Bunzl (BNZL): A Distributor with 20 Straight Years of EPS Growth and 27 Straight Years of Dividend Growth – Facing a Virus That’ll Break At Least One of Those Streaks
Bunzl (BNZL) is a business I’ve known about for a long time. However, it’s not a stock I’ve thought I’d get the chance to write about. The stock is not overlooked. And it rarely gets cheap. EV/EBITDA is usually in the double-digits. It had a few years – the first few years of the recovery coming out of the financial crisis – where the EV/EBITDA ratio might’ve been around 8 sometimes. It’s back at levels like that now. Unfortunately, the risks to Bunzl are a lot greater this time around than in the last recession. Why is that?
First, let me explain what Bunzl does. This is actually why I like the business. The company is essentially like an MRO (maintenance, repair, and overhaul) business. It’s a little different from them. In fact, I think it’s a little better than businesses like Grainger, MSC Industrial, and Fastenal. But, it offers its customers the same basic value proposition: we’ll take the hidden costs out of you procuring the stuff you buy that isn’t really what your business is about. What do I mean by that? Well, with Bunzl – the company is basically a broadline distributor of non-food, not for resale consumables. So, you go to a supermarket. You get a bagel out of the little bagel basket, glass case, whatever in your supermarket – you throw it in a brown paper bag. Bunzl doesn’t supply the bagel. It supplies the brown paper bag. You pick out some tomatoes and put them in a plastic bag and add a little green wrapper to the top to seal off the bag – Bunzl might supply the clear bag and the twist thing, it won’t supply the tomatoes. Obviously, I’m using examples of stuff the customer might come into contact with. Bunzl actually supplies a lot of stuff you wouldn’t come into contact with that also gets used up. But, the point is that Bunzl is neither a manufacturer of anything nor a seller of anything that goes on to be re-sold. It’s a pure middleman. It buys from companies that produce products that businesses will use – but won’t sell. It does bid for these contracts (like Grainger does with its big accounts). But, it’s unlikely that the price of the items is the most important part of the deal. Stuff like whether the company can do category management, deliver direct to your door (or, in some cases, beyond your door and into your stores and factories and so on), order fill accuracy, order delivery speed, consolidating orders, consolidating everything on one invoice, etc. is important. The case for using a company like this is usually not that you save a penny on some product they buy in bulk – instead, it’s that you eliminate the work that would be done inhouse by finding a bunch of different suppliers, comparing prices, tracking inventory, etc. That’s why I say Bunzl is like an MRO.
However, Bunzl would normally be probably more resilient than …
Read moreGainsco (GANS): A Dark Nonstandard Auto Insurer That’s Cheap Based on Recent Underwriting Results
Gainsco (GANS) is a dark stock. It does not file with the SEC. However, it does provide both statutory (Gainsco is an insurer) and GAAP financial reports on its website. These reports go back to 2012 (so, covering the period from 2011 on). Not long before 2011, Gainsco had been an SEC reporting company. Full 10-Ks are available on the SEC’s EDGAR site. Anything I’ll be talking about with you here today about Gainsco’s historical financial performance has been cobbled together through a combination of GAAP financials for the holding company (Gainsco), statutory financials for the key insurance subsidiary (MGA), and old 10-Ks.
Before I even describe what Gainsco does, let’s start with the company’s combined ratio.
An insurer’s combined ratio is the flipside of its profit margin. However, it covers only the underwriting side of the business. It ignores investment gains on the float generated by underwriting. A combined ratio of 100 means that economically the insurer is getting use of its float at no cost. A combined ratio above 100 means the float costs the insurer something. A combined ratio below 100 means the insurer is making a profit even before it invests the float. The combined ratio has two parts. One is the loss ratio. The other is the expense ratio. These ratios are calculated as fractions of the premium revenue the insurer takes in. So, the loss ratio gives us some idea of how much higher the insurer is pricing its premiums than actual losses will be. For example, a loss ratio of 75% would indicate the insurer priced premiums at about $1.33 for every $1 it lost (100%/75% = 1.33x). The expense ratio gives you an idea of how much of premiums are eaten up immediately by things like commissions, marketing, and a lot of the fixed costs of running an insurance operation. It’s everything other than the stuff that relates to losses.
Here is Gainsco’s combined ratio from 1998-2018 (excluding 2010):
1998: 134%
1999: 99%
2000: 124%
2001: 163%
2002: 143%
2003: 105%
2004: 97%
2005: 95%
2006: 108%
2007: 98%
2008: 99%
2009: 100%
EXCLUDED
2011: 99%
2012: 103%
2013: 99%
2014: 96%
2015: 99%
2016: 99%
2017: 94%
2018: 94%
Something obviously changed there. Till about 2004, Gainsco did other things besides “nonstandard” auto insurance. For the last 15 years, it’s stuck to just writing nonstandard auto insurance in a few (mostly Southern) states.
My guess is that about 80% of drivers seeking coverage in the total U.S. auto insurance market – this might be a bit different in the states Gainsco is in – would be considered standard or preferred risks. So, Gainsco only writes coverage for the bottom 20% of drivers. Gainsco is more of a niche business than just that though. A lot of Gainsco’s policyholders are Spanish speaking. And most are drivers in the states of Texas and South Carolina. My best guess is that Gainsco’s policyholder base is disproportionately made up of: 1) Spanish speaking drivers, 2) …
Read moreKeywords Studios: A good business with a leading niche in a terrific industry – but perhaps too expensive to buy (for now)
Written by: Vetle Forsland
Introduction
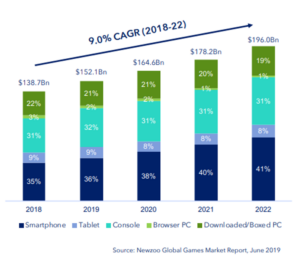
The video game industry is a large and rapidly growing market with revenues projected to reach nearly $200 billion this year, a consistent growth rate in the high single-digits, and over 2.3 billion gamers across the globe. As video games have developed in graphics, gameplay and story, while moving most of the gaming experience online, it has silently become the largest entertainment industry on the planet. According to IDG Consulting, by 2020, the video games industry will bring in more revenue globally than the music business, movie ticket sales and home entertainment combined, after an impressive 26 percent revenue jump from just two years ago. This write-up is centered around Keywords Studios (LSE:KWS), a niche leader set to benefit from all the major developments within this rapidly growing industry.
The Video Game Industry
Major video game releases put Hollywood to shame. While Avengers: Infinity War brought in $640 million globally during its opening weekend, Red Dead Redemption 2, released the same year, generated over $725 million in worldwide sales during its first three days.
The industry has gone through a big change over the past decade plus. First and foremost, the rise of online gaming, streaming and Esports turned video games from a relatively isolated experience into mass entertainment for everyone to enjoy.
For instance, the 2019 League of Legends World Championship drew 200 million viewers in 2019, more than twice that of the Super Bowl. Major players like Amazon (through its Twitch acquisition), Facebook (Oculus), Snap and Nike are entering the industry. Further, the casual mobile gaming market practically didn’t exist in the 2000s, but generated $38 billion in revenues in 2016, versus $6 billion for the console market, bringing gaming to everyone’s parents and even grandparents. Additionally, in its early history, video games were mostly a single-player activity – but the consoles of the early 2010s made online gaming the main form of gameplay, and together with streaming, turned the industry into something undeniably social.
In the years ahead, the video game market is expected to grow at a strong, consistent CAGR of 9 percent from 2019-2023. This increase is driven by the continued development of higher definition- and complexity games, next-gen consoles coming out in late 2020, and new ways of playing video games – like AR, VR, video game streaming, subscription models – as well as more sophisticated mobile games. It is in this market that Keywords Studios operates, without direct exposure to the successes or failures of individual game titles.
Keywords operates in a niche within the video game market that has grown, and will continue to grow, even faster than the overall industry – specifically the outsourced video game services “industry”, a niche set to continue to expand.
Why?
First of all, the video game industry is trending more and more towards outsourcing important tasks to third-parties, as video game developers experience increased complexity, volume and speed of content generation within competing …
Read moreTranscat (TRNS): A Business Shifting from Distribution to Services and a Stock Shifting from Unknown and Unloved to Known and Loved
Transcat is an interesting stock for me to write-up, because I probably have a bias here. Quan and I considered this stock – and researched it quite a bit – several years back. We were going to write it up for a monthly newsletter I did called Singular Diligence. All the old issues of this newsletter are in the stocks “A-Z” section of Focused Compounding. And – you’ll notice, if you go to that stocks A-Z section of Focused Compounding – that there’s no write up of Transcat there. I’ve never written about the stock. Why not? Back then, Transcat was a somewhat smaller company with a much, much smaller market cap. It didn’t do the kind of investor relations stuff it does now. Quan and I could read what management was saying and see the company was trying to move from being a distributor of test equipment to being a service company focused on calibration. Quan and I MIGHT have bought the stock for our own personal accounts (I’m not sure we would have, but I am sure we would’ve had an open mind about Transcat). But, those Singular Diligence newsletters were 10,000+ words long. I didn’t see how we could gather enough info on Transcat to write something that long. So, maybe it was a good stock. But, it probably wasn’t a good newsletter issue.
How does that make me biased now?
Well, in the years since I chose NOT to write it up for Singular Diligence – Transcat’s management did what they said they were going to do. The company has now transformed itself from mainly a distributor of handheld measuring equipment to mainly a calibration service provider. I don’t want to overstate this “mainly” part. If you look at each of the last two full years, I think Transcat got something like 48% and then 50% of its revenue, operating profit, EBITDA, etc. from the service segment and about the same amount from the distribution segment. However, looking at this fiscal year – Transcat is only 6 months into it in terms of what it’s reported so far – I’m getting a number for “adjusted EBITDA” (basically, EBITDA with stock compensation added back – Transcat has a lot of stock compensation) that tells me about 60% of the company’s profit is now coming from the service segment. The other 40% is coming from the distribution segment. That didn’t happen entirely due to a revenue spike in services and a decline in distribution. Part of what has happened this fiscal year is something Transcat’s management has been talking about for a very, very long time and only now really started to deliver on: margin expansion.
Margin expansion is probably the key to deciding whether or not to invest in Transcat. Right now, it’s a good and growing business. But, it’s not a great business. The company has never had amazing returns on capital. It does now use some debt (though usually closer to 1.5 times EBITDA in …
Read moreHilton Food (HFG): A Super Predictable Meat Packer with Long-Term “Cost Plus” Contracts and Extreme Customer Concentration at an Expensive – But Actually Not Quite Too Expensive – Price
Hilton Food Group (HFG) trades on the London Stock Exchange. It qualifies as an “overlooked stock” because it has low share turnover (17% per year) and a low beta (0.28) despite having a pretty high market cap (greater than $1 billion in USD terms).
On a purely statistical basis, Hilton Food is one of the most predictable – in fact, in one respect, literally THE most predictable – companies I’m aware of. There’s a reason for this I’ll get into in a second. But, first let me explain what I mean about the predictability here. Over the last 11-13 years, Hilton Food has shown very, very little variation in its operating margin. EBIT margin variation can be measured in terms of ranges (this would be 2.2% to 2.9% in the case of Hilton Food), standard deviations (this would be like 0.2% in the case of Hilton Food) or the coefficient of variation (0.08 in the case of Hilton Food). When talking about margin variation – I almost always am talking about this coefficient of variation, which is the standard deviation scaled to the mean. So, if a company had 27% EBIT margins on average and a 2% standard deviation or a 2.7% average margin and a 0.2% standard deviation – I’d talk about those two situations as if they were equally stable or unstable margins. Another way to look at it would be to think about standard deviations. If you own a stock for any meaningful length of time, you’re going to see one standard deviation and probably two standard deviation moves in margins. You may not see a three standard deviation move. And it’s entirely possible – unless something major changes with the business, which of course, it often does – you won’t see a 4 standard deviation move. With Hilton Food, a move of 4-5 standard deviations to the downside would only be a 1% of sales move in EBIT. Now, margins at Hilton Food are so low that 1% of sales is like 35% of EBIT and awfully close to 50% of earnings. So, it’s a big move. But, 4-5 standard deviation moves in margins are obviously unusual. And you’d be surprised how common 35% of EBIT to 50% of after-tax earnings swings are for many public companies. They happen all the time. I don’t want to go too far into the statistical weeds here – but, I will say that margin fluctuations that literally happen every 1-3 years for a normal company might only happen once in like 1-3 decades for Hilton Food. Now, Hilton Food has not been around for 3 decades (the original plant started operating in 1994 and the company only went public like 12 or so years ago). And what I’ve been discussing here is the predictability of earnings in cases where sales are fixed. Sales fluctuate. So, Hilton Food’s earnings will move around. It’s just that earnings will move around very, very little relative to sales compared to almost any other …
Read moreGeoff’s Thoughts on Cheesecake Factory (CAKE)
Someone asked me my thoughts on Cheesecake Factory. It’s a stock we’ve looked at before. But, I have written about it recently. The stock hasn’t done well lately. It looks fairly cheap. Here was my answer:
“I haven’t followed it lately. I know the stock hasn’t done that well. I did a very quick check of the stock price just now looking at the long-term average operating margin, today’s sales, today’s tax rates, etc. It seems that on an earnings basis (normalized for a normal margin on today’s sales) it would be about 13x P/E. That seems like a good price for a stock like this that has grown EPS almost every year. By the numbers alone, it reminds me of a Buffett stock. I was recently reading what I think is one of the best books on Warren Buffett. It’s called “Inside the Investments of Warren Buffett: Twenty Cases”. And one thing that stands out in each case study is his looking at the last 10-years or more of historical data. In time after time, the increase in revenue and net income and EPS year-over-year is positive in almost 10 out of 10 years. Sometimes it’s 9 out of 10 or something. But it’s very consistently positive compared to most stocks. Also, while people talk a lot about moats and high ROE – I’m not sure that’s as much as a focus for him. I think he looks more to find something that is already consistently showing good results year over year almost every year. Then, if the ROE is 20% or 30% – that’s enough for him. Because the stock is unlikely to be able to grow that fast anyway – it’s just a question of whether it can get a higher return on retained earnings than he can. ROE at Cheesecake Factory is generally adequate. It’s high enough that you could buy it based on its growth rate and P/E ratio. Now, I do notice that the 10-year results in terms of the top line really aren’t that strong. However, this has been true for a lot of restaurants in the U.S. I think Cheesecake also has the added problem that it doesn’t grow same-store real sales after the first year. These restaurants open VERY full compared to the industry. So, some companies have restaurants that do better in year 2 than year 1. That’s not the case here. But, the growth in things like earnings per share versus assets has been good. So, the economics have been – if anything – improving in terms of free cash generation versus the tangible assets used in the business. I’m not, however so sure it’s a growth stock anymore. But, in the company’s defense I think these last 10 years have been some of the toughest for restaurants. Inflation has been very low. Food inflation at supermarkets has been incredibly low to the point where eating in has been much more attractive than eating out. I don’t think that’s …
Read moreCanterbury Park (CPHC): A Stock Selling for Less than the Sum of Two Parts – A Card Casino and 127-Acres of Land (Plus You Get a Horse Track for Free)
Canterbury Park (CPHC) is a sum of the parts stock.
After our experiences – and when I say “our”, I mean my decisions to buy – Maui Land & Pineapple, Keweenaw Land Association, and Nekkar – Andrew has a sticky note on his desk that says: “When thinking about SOTP, think STOP”.
Canterbury Park (CPHC) is a sum of the parts (SOTP) stock. Since we’re thinking “SOTP” should we also be thinking “STOP”?
Yes, Canterbury Park is a sum of the parts stock. But…
That doesn’t mean it is primarily an asset play. Though it might be. I’ll talk about the company’s horse track and card casino in a second. But, first let’s get the hardest part for me to value out of the way.
I find it difficult to value the real estate assets of this business. So, I will be judging them based in large part on the range of per acre transaction prices – for both sales of land and purchases of land – I found in the company’s filings. Amounts paid or received per acre seem to range from about $180,000 to $385,000. Some of these deals are a bit more complex – for example, it’s difficult to determine what the price per acre the company received was when it exchanged land for an equity stake in an apartment complex or something like that. In one specific example of this – I would say the company exchanged about 1 acre of land for every 8 apartment units (I mean here the equivalent of owning 100% of 8 units, actual ownership is a minority stake in a greater number of units). Well, what exactly are 8 apartment units worth in the area? I don’t know. Could 8 apartment units be worth something in that same $180,000 to $385,000 range? Could it be more? I’d have to do a lot more research – and be a lot better at understanding real estate investments – to get definitive answers to how much Canterbury Park’s real estate is worth. It’s an important part of the investment case here. But, it’s not one I can evaluate well.
The real estate not being used by the business is 127 acres. Total real estate ownership is more like 370 acres. But, most of it is tied up in the horse track – so, I’ll limit discussion to the 127 acres that is planned to be developed into apartments, townhomes, extended stay hotels, etc. The lowest values I found for actual transactions the company has engaged in were around $180,000 per acre. If we assume the company receives the equivalent of $180,000 in value – sometimes in cash from sales of land, sometimes from equity stakes in joint ventures that rent out apartments for years to come, etc. – we’d place a value of about $23 million on all this real estate. It might be worth $25 million.
It could be worth a lot more than that depending on how it’s developed. For example, …
Read moreStella-Jones: Long-Term Contracts Selling Utility Poles and Railroad Ties Add Up to A Predictable, Consistent Compounder that Unfortunately Has to Use Debt to Beat the Market
Stella-Jones mainly provides large customers with pressure treated wood under contractually decided terms. The customers are mainly: U.S. and Canadian railroads, U.S. and Canadian electric companies, U.S. and Canadian phone companies, and U.S. and Canadian big box retailers. Stella-Jones has some other sources of revenue – like selling untreated lumber and logs – that provide revenue but no value for shareholders. The company also has some more niche customers – probably buyers for using wood in things like bridges, piers, etc. – that probably do provide some profit, but not profit meaningful in scale to the categories of customers I mentioned above. The company also sells some stuff that I’d consider more or less byproducts of their main business. Everything they do is clearly tied to either wood or the treatment of wood. Because there is less information about the smallest product categories the company sells and because those categories are either low or no margin or are probably too small to move the needle for making a decision about whether or not to buy this stock – I’m going to pretend Stella-Jones sells only 3 things: 1) Ties to U.S. and Canadian railroads, 2) Poles to U.S. and Canadian electric and phone companies, and 3) Pressure treated wood (for outdoor decking, etc.) to U.S. and Canadian big box retailers.
First, let’s discuss the economics of this business. One: the first two categories – railroad ties and utility poles – are super predictable, because the U.S. and Canada already have basically all the railroad ties and utility poles they’re ever going to need. What these countries need is simply annual replacement of those products. These are long-lived assets. On average: a utility pole can go 65 years before needing to be replaced. Railroads and utilities can defer replacement due purely to age. But, why would they? This isn’t the most expensive form of cap-ex to spend on. Eventually, network performance will degrade if they don’t maintain this stuff. And these are usually very, very creditworthy customers. They don’t have to rely on short-term borrowing from banks. Stella-Jones’s most important customers can all issue long-term bonds to raise the capital needed to fund not only normal maintenance projects but even growth cap-ex. So, there could be some cyclicality here. But, it’s probably a lot less than you’d think. It’s going to be far, far less cyclical than companies like suppliers of newer technology products to utility and telecom customers. It’s going to be a lot less cyclical than suppliers of locomotives to railroads. Although technically Stella-Jones is clearly selling a physical (and pretty much commodity) product to these customers – the economics here are going to look a lot more like they are being paid to maintain something on behalf of their customers. They’re providing a constant supply of replacement parts.
The physical scale of Stella-Jones and their customers is possibly a lot bigger than you might be thinking. What I mean by this is that the company moves a large …
Read moreOne Ratio to Rule Them All: EV/EBITDA
By Geoff Gannon
06/07/2012
For understanding a business rather than a corporate structure – EV/EBITDA is probably my favorite price ratio.
Why EV/EBITDA Is the Worst Price Ratio Except For All the Others
Obviously, you need to consider all other factors like how much of EBITDA actually becomes free cash flow, etc.
But I do not think reported net income is that useful. And free cash flow is complicated. At a mature business it will tell you everything you need to know. At a fast growing company, it will not tell you much of anything.
As for the idea of maintenance cap-ex – I have never felt I have any special insights into what that number is apart from what is shown in actual capital spending and depreciation expense.
When looking at something like:
- Dun & Bradstreet (DNB)
- Omnicom (OMC)
- Carbo Ceramics (CRR)
I definitely do take note of the fact they trade around 8x EBITDA – and I think that is not where a really good business should trade. It’s where a run of the mill business should trade.
I guess you could get that from the P/E ratio. But when you look at very low P/E stocks – like very low P/B stocks – you’re often looking at stocks with unusually high leverage. And this distorts the P/E situation.
Which Ratio You Use Matters Most When It Disagrees With the P/E Ratio
The P/E ratio also punishes companies that don’t use leverage.
Bloomberg says J&J Snack Foods (JJSF) has a P/E ratio of 21. And an EV/EBITDA ratio of 8. Meanwhile, Campbell Soup (CPB) has a P/E of 13 and EV/EBITDA of 8. One of them has some net cash. The other has some net debt. J&J is run with about as much cash on hand as total liabilities.
They can do that because the founder is still in charge. But if Campbell Soup thinks it can run its business with debt equal to 2 times operating income – then if someone like Campbell Soup buys J&J, aren’t they going to figure they can add another $160 million in debt. And use that $110 million in cash someplace else.
And doesn’t that mean J&J is cheaper to a strategic buyer than its P/E ratio suggests.
That only deals with the “EV” part. What about the EBITDA part? Why not EBIT?
Don’t Assume Accountants See Amortization the Way You Do
The “DA” part of a company’s financial statements is usually the most suspect. It’s the most likely to disguise interesting, odd situations.
Look at Birner Dental Management Services (BDMS). The P/E is 21. Which is interesting because the dividend yield is 5.2%. That means the stock is trading at 19 times its dividend (1/0.052 = 19.23) and 21 times its earnings. In other words, the dividend per share is higher than earnings per share. Is this a one-time thing?
No. The company is always amortizing past acquisitions. So, the EV/EBITDA of 8 is probably