Posts In: Premium Articles-01

Geoff Gannon December 24, 2017

Cars.com (CARS): A Cheap Enough Stock with a Clear Catalyst and Tons of Rivals

About a week ago, Starboard Value disclosed a 9.9% position in Cars.com (CARS). Starboard Value is an activist hedge fund. It is probably best known for its 294-page presentation on Darden Restaurants (DRI) back in 2014. You can read that presentation here (PDF). Cars.com is a 2017 spin-off from Tegna (TGNA). Tegna is the rump of the old Gannett. It consists mostly of local TV stations. The public company now called Gannett (GCI) was spun-off from Tegna (then known as Gannett) in 2016. It consists mostly of USA Today (a national newspaper in the U.S.) and about 100 local newspapers.

So, in a sense, the public company Cars.com was formed as a break-up of a break-up.

Cars.com is a research website for car shoppers. Publicly traded competitors include CarGurus (CARG) and TrueCar (TRUE). TrueCar went public in 2015. You can read its IPO prospectus here. CarGurus went public in October of this year. You can read its IPO prospectus here. Because Cars.com was a spin-off instead of an IPO, the SEC document it filed is different. You can read Cars.com’s 2017 spinoff document (its S-1) here. The company has yet to file a 10-K. You can read the most recent 10-Q here.

I’m not going to describe what Cars.com does, because you can visit the website or download the app (today, most people use the app) and play the role of customer for yourself. No description I can give you will explain the company better than having you just give the website a whirl.

So, I’m not going to explain Cars.com’s business. What am I going to do?

I’m going to explain why I’m writing to you about the stock.

I’m writing to you about Cars.com stock for 3 reasons:

  1. An activist hedge fund, Starboard Value, now owns just under 10% of the company
  2. The stock’s history is that Cars.com was bought by Gannett (then a TV and newspaper company) in 2014 and then Gannett broke into two parts in 2016 (Cars.com went with the TV part) and finally Cars.com was broken off of an already broken-off company. So, there are no long-time owners/analysts/etc. of Cars.com stock and many of the investors who have held the company’s – or its predecessor’s – shares were not originally interested in owning a website.
  3. Some competitors of Cars.com trade at much higher multiples of sales, earnings, etc. than Cars.com does.

In other words: this is a Joel Greenblatt “You Can Be a Stock Market Genius” type situation. The company is the end result of a fairly recent (2014) acquisition and two very recent (2016 and 2017) spin-offs. Most importantly, the stock appears to be a relative value.

Is it a good business?


Quality

The business model is theoretically a good one. And the company’s current financial results are very solid. A website like this has economics similar to a local TV station. For full-year 2017, management is guiding for an adjusted …

Read more
Geoff Gannon December 8, 2017

The Cheesecake Factory (CAKE): A Second Opinion

Guest write-up by Vetle Forsland


Introduction


The Cheesecake Factory operates 208 restaurants primarily in the US. Of these locations, 194 of them are The Cheesecake Factory-restaurants, 13 are under the Grand Lux Café-brand, and one under the RockSugar Southeast Asian Kitchen mark. Additionally, they have 15 Cheesecake-branded restaurants in other parts of the world. These are all upscale casual dining restaurants. The customer eats freshly prepared food in the restaurant while a waiter provides table service. On average, a check from their restaurants was $21 (per person) in 2015, and $20.20 in 2016. The overwhelming majority (91 %) of the company’s sales comes from The Cheesecake Factory chain. The Cheesecake Factory restaurants offer high-quality food at moderate prices, with more than 200 items on their menu including 50 or so cheesecakes. It is known for its ginormous portion sizes and high-calorie dishes. Their core menu offerings include appetizers, pizza, seafood, steaks, chicken, burgers, pastas, salads and sandwiches, and they review and update their menu twice a year. The locations are large, open dining areas with a modern design. This means that Cheesecake Factory locations require higher investment per square foot than typical casual dining restaurants – but Cheesecake also has higher sales per square foot than competitors.


The Cheesecake Factory originated in 1972, when a small bakery opened in Los Angeles by Evelyn Overton. In 1978, her son, David Overton (who is still CEO of the company) opened the very first Cheesecake Factory restaurant. It was a huge success, with long lines on opening day. Overton quickly expanded the concept to other parts of the country, and in 1992, the company was incorporated as The Cheesecake Factory Incorporated in Delaware. Since 1997, Cheesecake has opened 11 restaurants a year, meaning an annual restaurant count growth of 15.8 % (7.4 % for the past 10 years). Management believes there is room for 300 Cheesecake restaurants in the US. Basically, this means that they will be able to open ~7-10 restaurants of their crown jewel a year for the next 10-15 years. In addition to this, the company is pursuing several incremental growth opportunities.


The stock price has fallen from a 52-week high of $67/share to $45/share (after dipping to $38 earlier this fall). This dramatic sell-off is most likely caused by declining same-stores sales. In May, Cheesecake reported a like-for-like growth of 0.3 %, and a -2.3 % decline in traffic. Restaurant chains often go through years of consecutive growth in same stores sales, with periods of consecutive quarters of declining same stores sales in between. So this is not very unusual in this business. The company also reported a decline of 0.5 % in Q2, which caused further sell-offs. Cheesecake stock has fallen about 35 % since the Q1 announcement. Furthermore, they are currently forecasting comparable sales decline of about 1 % for the full fiscal year.


Durability


The restaurant industry is a very durable industry. The demand for eating out is consistent in the US, and …

Read more
Geoff Gannon December 6, 2017

The Cheesecake Factory (CAKE)

 Guest write-up by Jayden Preston


Fellow Focused Compounding member Kevin Wilde has written two posts on The Cheesecake Factory (over at the “Idea Exchange”). I suggest you read his posts first to get a better glimpse at the company’s financials. This article is intended to be a more qualitative one.


Overview


Originated in 1972, the predecessor of The Cheesecake Factory was a bakery operation founded by the parents of Chairman David Overton in Los Angeles. In 1978, David Overton led the creation and operation of the first The Cheesecake Factory restaurant in Beverly Hills, California. This essentially led to the inception of the upscale casual dining segment in the US.


Fast forward nearly 40 years, The Cheesecake Factory now operates 209 Company-owned restaurants, comprised of 195 restaurants under The Cheesecake Factory brand name; 13 restaurants under the Grand Lux Café mark and one restaurant under the Rock Sugar Pan Asian Kitchen name. Internationally, 18 The Cheesecake Factory restaurants are operated through licensing agreements by their partners overseas. The Company also has a baking segment, running two bakery production facilities in the US. All the cheesecakes served in their restaurants, including international licensees and third party bakery customers, are made at either of these two facilities.


Operating in the upscale casual dining segment, their average check per customer, including beverages and desserts, is above $20 per customer.


In Nov 2016, they have also invested $42 million for minority stakes in two concepts, North Italia and Flower Child, and will provide growth capital for them going forward.


As restaurants bearing The Cheesecake Factory brand still delivers most of the value in this company, we will focus our following analysis on them.


Major Differentiation Points


Their restaurants are different from most restaurant chains in the following ways:


  1. Except their desserts being produced at their bakery facilities, substantially all other menu items are prepared from scratch locally at their restaurants, with fresh ingredients.
  2. Their restaurants are huge with size ranging from 8,000 square feet to 12,000 square feet.
  3. The capital investment per square foot for each of their restaurant is thus higher than most, even in the casual dining industry. It usually costs $8 million or more to set up one new restaurant.
  4. Offsetting point number 3 is the unusually high sales per square foot generated in their restaurants. Particularly, the average The Cheesecake Factory restaurant generates above $10 million in sales per year, averaging close to $1,000 in sales per productive square feet.
  5. Extensive menu covering a huge variety of dishes, appealing to a diverse customer base across a broad demographic range. The Cheesecake Factory menu features more than 200 dishes. The menu is updated twice every year.
  6. Higher percentage of sales from desserts than average. Dessert sales was 16% of revenue in FY2016.


Durability


The business of restaurants is durable as long as humans exist, because I believe eating out will never go extinct. Instead, a …

Read more
Geoff Gannon November 29, 2017

Zooplus

Zooplus

Guest write-up by Vetle Forsland


Introduction


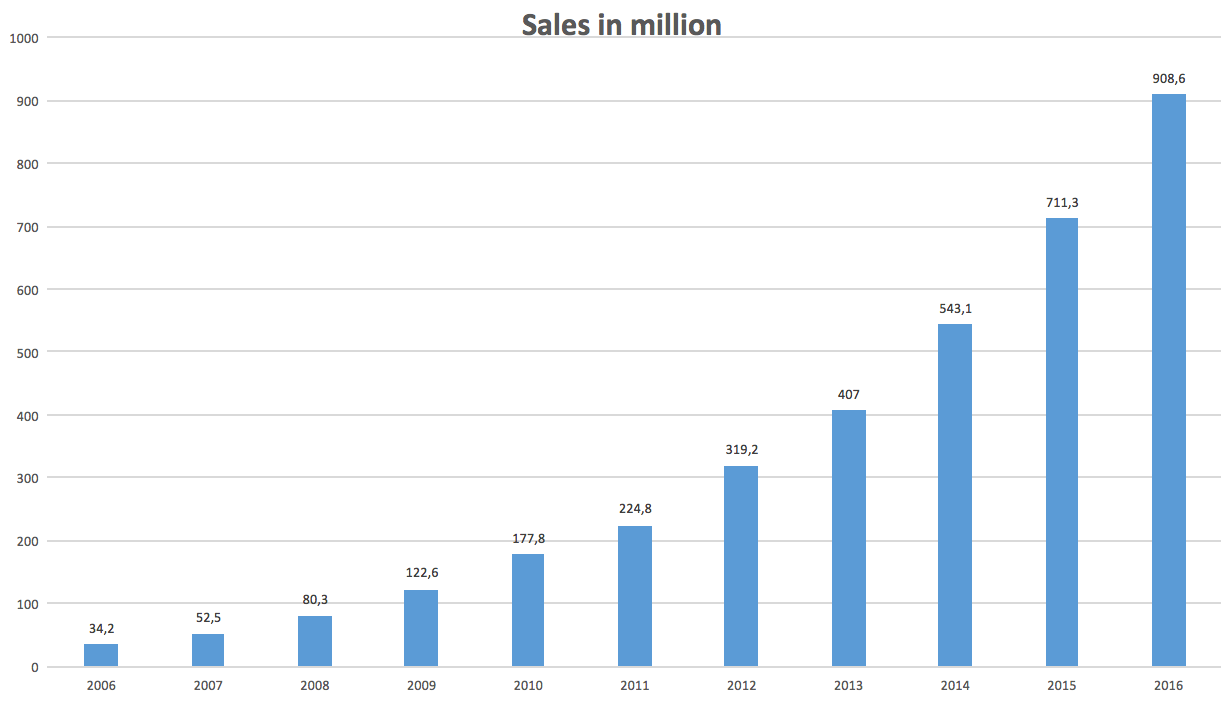
Zooplus is the leading online pet food retailer in Europe. It has on average grown sales 38% annually since 2006 (IPO in 2008) and annualized sales growth since 2010 is a 31%. In 2016 sales grew by 28%, to 908 million EUR, and there is room for additional expansion. Generally, the retailer with lowest prices and best customer service will come out as the industry leader. I believe this will be Zooplus. Lower prices and good customer service will lead to a high customer retention rate, the latter being at 92 % today. At the same time, this is a company with a lot of room for future growth, good financials and no debt.

Since its foundation, Zooplus has grown to become the clear leader in online pet supplies in Europe. The company also ranks number 3 in the overall European market for pet supplies after Fressnapf and Pets at Home. As Zooplus grows, it will become more cost efficient through economies of scale. More revenue will justify building distributing centers, which will bring the depressed margins today upwards, and create a good profit for shareholders.


Zooplus was formed in 1999, and has been operating in the pet market for more than 17 years, and on the way launched their business model in 30 countries. Pet supplies is a big segment of the European retail industry. In 2016, gross sales of pet supplies added up to around 26 billion EUR. Because of higher populations and more pets in the majority of countries, I expect this figure to continue growing over the years. Furthermore, Europe is expected to see considerable growth in online retailing, which will propel Zooplus’ sales momentum.


Pet supplies is not a cyclical industry. Sure, people will try to avoid high-end pet food brands in economic downtrends – but unless they want Kitty to starve, pet food will forever be in high demand. I believe Zooplus is in a good position to make money from these facts.


Online groceries have not lived up to the potential they once were estimated to have, so why do I think customers will shift to online pet supplies in the future? (only 6.8% of pet supplies are sold online). First of all, our beloved pets need food just as much as we do. As pet food has a (very) long expiration period, pet owners will want to buy it in bulks for lower prices – to make sure they’re never out of food for the little ones. That’s how my parents (and I) buy pet food in Norway. However, in brick and mortar stores, it is problematic for customers to buy in large bulks, since they actually have to carry the bags from the store and home. Additionally, Europeans live in dense and urban areas, where public transportation/walking is more common, making it even more difficult to buy pet food in bigger bulks.


The online pet food segment has solved this …

Read more
Andrew Kuhn November 27, 2017

Quick Summary of 2 Businesses I’ve Studied Recently


CARS- Cars.com recently completed the spinoff from their parent company Tegna Inc, and started trading as its own publicly traded company on June 1st. Geoff and I did some research on the company a little over a month ago and we have been watching from the sidelines ever since. Cars.com is a very capital-light, cash flow generative company with a solid brand and one I would say is not going to “go-away” within the next 10 years. This all being said, they operate and compete in a very crowded space and their competitors are spending much more of a % of revenue on marketing than Cars.com is. Geoff and I thought a lot about this and we couldn’t exactly figure out why.

Their Main Competitors Are..

  • Truecar
  • CarGurus
  • Autotrader

From looking at the other competing company websites I would say that Truecar and Cars.com is the best-looking website out of the group. Here is a quick breakdown of their financials where you will see the % of revenue spent on marketing.

Cars.com TrueCar CarGuru
Sales 309.8 157.6 143.3
Cost of sales -4.7 -13.5 -7.7
Marketing -109.5 -89.1 -104.6
EBIT 56.2 -13.6 12.2
Marketing % of sales 35% 57% 73%
EBIT Margin 18% -9% 9%


Management is forecasting revenue to finish down -1% in 2017, which obviously is not too appealing to many investors. This being said, CFO Sheehan has said in an earnings call that they expect the business to grow in 2018. After the spinoff, Cars.com opened at $25.34 and now currently trades at $24.47. The stock probably has not performed well since the spinoff due to the parting gift to Tegna of $650m. But, due to the companies cash flow generative nature, I don’t believe this will be an issue going forward. Also, I believe the stock currently is priced as a “no growth going forward” type of stock. If they can resume to top line growth and continue to produce significant free cash flow, I think if the stock falls back down to the $20 per share area it can make for an interesting investment over the next 2-5 years. This company is on my watch list of a company I would like to own at a future price if given the chance by Mr. Market.

Market Cap ($Mil) EV/EBITDA P/S EBITDA MARGIN
Cars.com $1,755 10.1x 1.17 37%
TrueCar $1,180 N/A 3.43 -5.70%
CarGurus $2,266 99.4x 10 10.40%
Auto Trader $4,210 16.3x 10.57 67.80%


Papa John’s

PZZA – I started to get interested in learning more about Papa John’s business because first, I love pizza (who doesn’t?) and second, because I saw in the news that Papa John’s was blaming the NFL on slowing pizza sales, which caused sort of a media frenzy. Although I don’t know if Papa John’s blaming the NFL on slowing pizza sales is a valid claim or an excuse, I’m not exactly sure if the stock is exactly cheap. In addition, Domino’s Pizza is definitely a far …

Read more
Andrew Kuhn November 10, 2017

Green Brick Partners Q3 Earnings: It’s still cheap…

Green Brick Partners reported earnings this past week on November 6th. For those of you who don’t know much about the company, here is a summary that Geoff wrote about the company back in September:

“Green Brick Partners is a homebuilder that is split close to evenly between Dallas Fort-Worth (it builds homes in places like Frisco, which is right by where I live in Plano) and Atlanta. I don’t know the Atlanta housing market. But, I do know the Dallas housing market. The stock trades at about 1.1 times book value. However, in the homebuilding industry, land is usually held for 2-5 years from the time a homebuilder buys it to the time they sell the finished house on that land. Land prices in Dallas Fort-Worth have risen, so the fair value of their holdings would actually somewhat exceed 110% of book value – meaning, the market value of the company’s assets is slightly greater than the market cap of the company. They have enough net operating loss carryforwards to not pay taxes for another 3-5 years depending on how much they grow earnings. The decision maker (Jim Brickman) is a good homebuilding guy and has a meaningful personal stake in the company. Together with David Einhorn’s Greenlight capital (about a 50% owner) and Dan Loeb’s Third Point (about a 17% owner) people who are insiders/long-term investors of some kind hold about 75% of Green Brick Partners. So, the float is probably no more than $125 million. The stock was, in recent memory, a speculative ethanol type company that was used as the public entity to take this Einhorn/Brickman homebuilding entity public. In investors’ minds, the company is probably not “seasoned” as much as it’s going to get in the sense that if I say “Green Brick Partners” today – you may not have recognized the name and if you did you may not have immediately remembered it’s a homebuilder and even if you did remember that you still might not have remembered where it builds home (Dallas and Atlanta). It’s underrecognized. If you buy the stock in 2017 and plan to sell it in 2022, you’ll probably be selling a bigger, more recognized stock with a higher price-to-book multiple that is then starting to pay taxes.

A homebuilder is not the kind of stock I’d usually buy. Green Brick isn’t a capital light pure homebuilder like NVR (NVR). Nor is it more of a marketing machine like LGI Homes (LGIH). It’s something that buys up land, holds it for up to five years, puts a house on it, and then sells the land plus the house. There’s no cash flow that doesn’t go back into buying up more land. Everything it does is tied to residential land values where it operates. So, this is purely an investment in residential land in Dallas and Atlanta. However, the combination of UNTAXED (for now) cash flow from homebuilding activities going back into buying additional land plus the annual appreciation

Read more
Geoff Gannon November 3, 2017

NACCO (NC): First Earnings Report as a Standalone Company

Two days ago, NACCO (NC) released its first quarterly results as a standalone company. Yesterday morning, the company had its first earnings call as a standalone company. The stock dropped 10% following these events. I’m not going to write about NACCO each quarter. But, some people asked for my thoughts on the quarter and the stock drop. So, I’ll do it this once.

Overall, the earnings call and the stock drop reinforced my belief that it could take a year or more of NACCO trading “cleanly” as a separate company before it’s well understood by investors. More on that at the end of this post.

First, the earnings release. Here, everything was as expected.

You can – and should – read NACCO’s full earnings release here. These are the items I highlighted:

  • “After the completion of the spin-off, NACCO ended the third quarter with consolidated cash on hand of $93.9 million, debt of $58.7 million and net cash of $35.2 million.  The cash on hand included a $35 million dividend received from the housewares business prior to the completion of the spin-off.” So, the company now has $5.13 in net cash per share.
  • “NACCO’s board of directors will evaluate and determine an ongoing dividend payout rate at its next regularly scheduled meeting in November. When doing so, the board will consider the financial conditions and prospects of NACCO and North American Coal following the spin-off of the housewares-related business.” We’ll see what they decide to start the dividend at. The “financial conditions” are strong. The “prospects” are bleak.
  • Not a highlight, but a note: The after-tax numbers are meaningless here because of a very unusual tax timing situation. The company had a 44% tax rate on continuing operations. In the future, I expect the normal tax rate for NACCO as a standalone company will be 23%. So, ignore all after-tax numbers.
  • Centennial is NACCO’s consolidated (so NACCO bears all the risk) failed mine: “Centennial will continue to evaluate strategies to optimize cash flow, including the continued assessment of a range of strategies for its remaining Alabama mineral reserves, including holding reserves with substantial unmined coal tons for sale or contract mining when conditions permit. Cash expenditures related to mine reclamation will continue until reclamation is complete, or ownership of, or responsibility for, the remaining mines is transferred.”
  • NACCO confirmed that the customer will bear the risks related to the Kemper plant / Liberty mine failure and NACCO will be paid to do the mine closure work: “The terms of the contract specify that Mississippi Power is responsible for all mine closure costs, should that be required, with the Liberty Mine specified as the contractor to complete final mine closure. Should the decision to suspend operations of the gasifier and mine become permanent, it will unfavorably affect North American Coal’s long-term earnings under its contract with Mississippi Power.”
  • “…capital expenditures are expected to be approximately $21 million in 2018.”
  • “While the current regulatory environment for development of new
Read more
Geoff Gannon October 25, 2017

Cimpress (CMPR)

Guest Write-up by Jayden Preston


Introduction

Vistaprint was founded in 1994 by Robert Keane, on the idea that there was a market for producing business cards cheaply for companies too small to order in large quantities. Through utilizing the internet, creating better software and printing technologies to make such mass customization cost effective and efficient, the business has turned out to be a huge success.

23 years later, Vistaprint has become a clear leader in mass customization of marketing materials for small businesses. It has also increased its portfolio of businesses and target markets through acquisitions and now offers thousands of products that customers can customize to their needs. It was renamed to Cimpress in 2014 to reflect their growing number of business units.


Business Summaries

Cimpress has changed their business segmentation a number of times in the past. We look at their current segmentation below:

1. Vistaprint

This is still their core business. Vistaprint currently operates globally, with a special focus on North America, Europe, Australia and New Zealand markets. Their Webs-branded business is also grouped under Vistaprint.

The target customers of Vistaprint are micro businesses, i.e. companies with fewer than 10 employees. Since they are small operations without marketing expertise, they rely heavily on the software technologies provided by Vistaprint when designing and making their marketing materials.

In FY2017, Vistaprint served 17 million micro businesses and generated $1.3 billion in revenue, representing 60% of Cimpress’s overall revenue. Adjusted net segment operating profits were $165 million, for a margin of 12.6%. This is a depressed margin though. The two-year average from FY2015 and FY2016 is higher than 17%.

2. Upload and Print

This segment is mostly built up through acquisitions. Companies/brands in this segment include: druck.at, Easyflyer, Exagroup, Pixartprinting, Printdeal, Tradeprint, and WIRmachenDRUCK businesses. These companies mostly focus on Europe.

Some companies that have more resources would look for professional graphic designers, ranging from local printers, print resellers and graphic artists to advertising agencies and other customers with professional desktop publishing skill sets, for their marketing needs. The segment focuses on serving such graphic professionals.
As a group, they generated $589 million in revenue in 2016, which is 28% of the total. Adjusted net segment operating profits were $64 million, for a margin of 10.9%

3. National Pen

This business was acquired at the end of 2016. Given its scale and vertical integration, National Pen is the leading provider of a wide array of customized writing instruments for small- and medium-sized businesses in more than 20 countries. The company also sells other promotional products, including travel mugs, water bottles, tech gadgets and trade show items.

It serves about a million small business customers through a successful direct mail marketing and telesales approach, as well as a small growing e-commerce business.

The business generates around $113 million in revenue.

4. All Other Businesses

This segment includes the recently sold Albumprinter, Most of World, and Corporate Solutions businesses. These businesses have been combined into one reportable segment based on …

Read more
Geoff Gannon October 19, 2017

What’s NACCO’s Margin of Safety?


After reading my write-up, a member asked me about the margin of safety in NACCO (NC):

“…why would someone put half of their portfolio weight in a stock like this where there is customer concentration risk plus a real risk that one of the customers may close shop? Agree that its FCF yield is 10% or so but does it deserve that kind of weight?”

I don’t want to exaggerate the safety of this stock. I didn’t write it up for a newsletter. This isn’t a recommendation for anyone else to buy it. I put 50% into it knowing I would have future control over decisions to sell that 50%. I don’t think I’d recommend this stock to anyone else because the headlines will all be negative and that is very tough for people to hold through.

Having said that, let me take you through how I might have seen the potential margin of safety when I bought the stock at under $33 a share on October 2nd. The way I framed it, the margin of safety in NACCO was a lot higher than what I can get in other stocks. That’s despite the customer concentration and the possibility those concentrated customers are coal power plants about to be shut down.

When I bought the stock, I believed it was then trading at something like a 10% to 15% free cash flow yield. I also believed that the company’s balance sheet will be essentially unleveraged pretty soon (taking into account build up of cash during this year, the expected $35 million cash dividend from Hamilton Beach just before the spin, etc.). The parent company has liabilities but these are not immediately payable in full. Meanwhile, the unconsolidated mines pay cash dividends immediately each year. So, what I’m saying here is that I don’t believe the parent company is more leveraged, more short of cash relative to potential liabilities, etc. than an average stock.

So, the balance sheet is like an average stock.

But, a normal, unleveraged stock usually trades at about a 5% free cash flow yield.

So, NACCO’s free cash flow yield is 5% to 10% higher than an average stock while the balance sheet is similar.

Now, if it is true that when NACCO loses a big contract this means it mostly loses an equal percentage proportion of both revenues and expenses (this is an exaggeration – but I don’t think it’s a huge exaggeration because the mines really are administered very independently and are non-recourse to NACCO), you can kind of think about your margin of safety and the value in this stock as follows…

NACCO has a free cash flow yield no lower than 10% to 15%.

A normal stock has a free cash flow yield no higher than 5%.

5% is 0.50 to 0.67 times less than 10% to 15%. Therefore, NACCO would decline to a normal valuation after it has lost about 50% to 65% of its earnings. Let’s …

Read more
Geoff Gannon October 18, 2017

Does NACCO (NC) Have Any Peers?

A Focused Compounding member who analyzed and bought NACCO himself read my write-up on NC and was curious if I did a “peer analysis” for NACCO:

“Did you consider looking at any potential peers with your analysis? I was quite simplistic with my approach. Omnicom splits cash out year in year out. Its current EV to free cash flow is around 10x whereas I looked at NACCO and thought its EV to free cash flow was around 5x (NOTE: At the much lower spin-off price he bought at) and appeared very undervalued as it should at least be 7 to 10x even though Omnicom is a higher quality business. My hurdle for any new position is Omnicom.”


I tried to keep it simple. Really, I asked myself 3 questions early one:


  1. After the spin-off, will the balance sheet be pretty close to net no debt/no cash (you did something similar seeing there would be the $35 million dividend but then there’s the asset retirement obligation and the pension).


  1. Would NACCO produce its earnings mostly in the form of free cash flow?


  1. Would “earning power” be 10% or higher as a percent of my purchase price.


In the end, the decision is really just whether you would buy a stock or wouldn’t buy a stock. To me it didn’t matter if the stock’s earnings would be $3.25 a share or $6.50 a share if I was buying at $32.50. What mattered was how certain I was of the $3.25 number. Once I think I have a 10% yield, I don’t spend a lot of time wondering if I have a 13% yield, 15% yield, or 20% yield. So, I didn’t spend time worrying about this. If the stock was pretty much unleveraged, the earnings pretty much came in the form of free cash flow, and the earnings yield was greater than 10%, that would be enough.


As far as growth, it’s difficult to value that. The company has a goal of growing earnings from unconsolidated mines by 50% within the next 5 years or so. However, they had the same goal about 5 years ago. Because the Kemper project was cancelled, they won’t achieve this. However, they will achieve growth of say 15% or so over last year due to newer mines producing closer to the tons they were eventually expected to produce.


I don’t know what they’ll use free cash flow on. I know that the two businesses I like are the unconsolidated contracted coal production and the lime rock draglines. But, neither of those businesses absorbs capital. So, they will grow through signing new deals in that area but they shrink through losing existing customers. I couldn’t judge one way or the other on this.


I feel they have no peer. Omnicom (OMC) is not a good peer, because OMC is permanently durable in my view. I think advertising agencies will be around in 2047 and even 2067. It’s …

Read more
Skip to toolbar