Posts In: Stock Ideas

Geoff Gannon June 27, 2018

Maui Land & Pineapple (MLP): 900 Acres of Hawaiian Resort Land for $250,000 an Acre

Maui Land & Pineapple (MLP) owns real estate on the island of Maui (which is in Hawaii). The company has 22,800 acres of land carried on its books at prices dating back to the 1911 to 1932 period. So, book value is meaningless here. The total size of the land holdings is also meaningless here. Of the 22,800 acres, 9,000 acres are conservation land. That leaves only 13,800 acres of potentially productive land. Almost all of that (12,900 acres) is zoned for agriculture.

That leaves 900 acres zoned for residential use.

Let’s compare those 900 acres of land to the company’s enterprise value to get a sense of just how expensive this stock is on a price per acre basis. The company has 19.18 million shares outstanding. As I write this, the stock price is $11.40 a share.

Since we’re talking shares outstanding, I’m going to pause to discuss liquidity. I may run managed accounts focused on the most illiquid stocks out there (because I believe stocks with wide bid/ask prices tend to be less efficiently priced than stocks that trade constantly at almost no spread), but I know some members of Focused Compounding prefer more liquid investments. MLP should be liquid enough for everyone. The stock trades about $300,000 worth of shares per a day. It’s listed on the New York Stock Exchange.

Now, a bonus aside for those interested in ultra-illiquid stocks: if you’re interested in Maui Land & Pineapple after reading this write-up, you should definitely check out is closest “peer” of sorts – Kaanapali Land LLC (KANP). KANP is an illiquid (it trades about $2,000 worth of stock on an average day) over-the-counter stock. I’m not going to discuss KANP here. However, what land it owns – which I think is much more speculative and possibly worth much less than the land I’m about to discuss owned by MLP – is only something like 4 miles from the land we’ll be talking about here.

Now back to the enterprise value calculation. MLP stock is at $11.40 a share and there are 19.18 million shares outstanding. So, that’s $11.40 times 19.18 million equals $219 million. You can find the company’s 10-Q on EDGAR and decide how much net cash or net debt to add to that $219 million to get the correct enterprise value. There’s a tiny bit of cash, a tiny bit of debt, some retirement benefit obligations, etc. For our purposes, all balance sheet items excluding the 900 acres of residential zoned land are a rounding error. So, I’m going to round the market cap up from $219 million to $220 million and call that the enterprise value.

Now, we can calculate the price ratio that matters most here. It’s not price-to-book (meaningless because the land is carried at at 1911 to 1932 values) or price-to-earnings (also meaningless because it includes land sales which are very lumpy from year-to-year). It’s enterprise value per acre. So, that’s $220 million in EV divided by 900 acres of …

Read more
Geoff Gannon June 13, 2018

Monro (MNRO): A Durable Automotive Service Chain Executing a Roll-Up

Article by DAVE ROTTMAN


Introduction and Overview

Monro (MNRO) is a large chain of auto shops providing a wide range of automotive service and repair work in the United States with company-operated stores servicing 6.2 million cars in the fiscal 2018 year ending 03/31/2018. While originally based out of the Northeast, Monro has been executing a roll-up strategy for decades, slowly widening their coverage as they expand both south and west. As of the end of fiscal year 2018, Monro had 1,150 company-operated stores, 102 franchised locations, 5 wholesale locations, 2 retread facilities, and 2 dealer-operated stores. These locations are spread across 27 states and operate under the following brands: Monro Muffler Brake & Service, Car-X, Tread Quarters Discount Tire, Mr. Tire, Autotire Car Care Center, Tire Warehouse, Tire Barn Warehouse, Ken Towery’s Tire & Auto Care, and The Tire Choice.

One of the largest operators of automotive repair and service shops in the US, Monro has used a roll-up strategy to become one of the lowest-cost operators by building an increasingly dense network of auto shops that result in improved economics through the sharing of distribution, marketing, and management costs. Further, as a large purchaser of aftermarket auto parts, Monro enjoys relatively more bargaining power than most of its competitors. These factors have resulted in increasingly superior margins, decent economics, and consistently competitive prices for its customers. While this acquisition-based strategy has been in the works for decades, the industry is still incredibly fragmented and offers a long runway of growth for Monro to continue to deploy capital in acquiring and developing new shops. This will serve to further improve operating efficiencies, and thus economics, and allow Monro to continue to offer its work at very competitive prices.

In addition to the long runway of growth, Monro is a durable business with strong and stable cash generation. This is because people must continue to service their vehicles in all economic climates. Historically, Monro has held sales, margins, and cash flow strong during downturns. In fact, Monro is somewhat countercyclical in that when new car purchases are halted, repairs are increased. This allows Monro to do especially well in a downturn. As we approach a decade-old bull market, the new cars sales cycle begins its descent, the average age of vehicles on the road increases, the number of vehicles on the road increases, the shift away from DIY auto work continues, and the number of service bays decreases, there are a confluence of factors that bode well for Monro’s future earnings power.


The Business

Monro’s business is broken into two main categories: undercar service and repair and tire sales and service. Monro categorizes its shops as either service stores or tire stores. In reality, there is a large degree of overlap in these locations where you see the service stores doing tire work and the tire stores doing non-tire service work. For example, in 2018 23% of service stores’ revenues were related to tires, and 40% of tire …

Read more
Andrew Kuhn May 25, 2018

Pandora A/S (CPH: PNDORA)

Member Write-up by Luke Elliot


Note: Sponsored ¼ share ADRs also trade under “PANDY” in U.S. Dollars


Pandora A/S is the largest jewelry maker in the world 

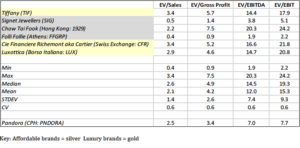
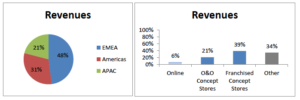
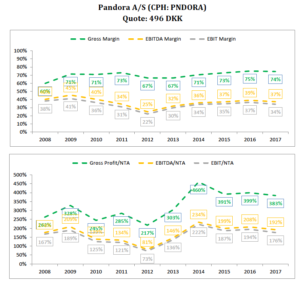
Overview Pandora is a vertically integrated jewelry maker that has rapidly grown from a local Danish Jeweler’s shop to the world’s largest jewelry manufacturer, producing more than 100 million pieces of jewelry in 2017. The original jeweler’s shop in Copenhagen, Denmark, was opened by goldsmith Per Enevoldsen and his wife Winnie in 1982. The company quickly transformed from a local shop, to a wholesale retailer, to a fully integrated global behemoth that designs, manufactures, directly distributes (in most markets), and retails its own jewelry. The company now sells in more than 100 countries through 7,800 points of sale. If you’ve ever been to a grade-A mall during Christmas or Valentine’s Day, you’ve probably witnessed the crazy lines snaking out of their small glass stores. Jewelry makers are segmented by price: Affordable (less than 1,500 USD), Luxury (1,500-10,000 USD) and High-End (greater than 10,000 USD). Pandora is in the affordable category by price but claims to have an ‘affordable-luxury’ brand. The company gets a little less than half (48%) its sales from EMEA (with 71% coming from UK, Italy, France, and Germany), about one-third (31%) from Americas (with 74% from US) and one-fifth (21%) from APAC (with 43% from Australia and 28% from China). The company’s sales are geographically diverse and in mature markets. To make it easy, let’s break down Pandora’s business model into two main retail formats:

1) Concept Stores (about one-third owned and operated by the company and two-thirds franchised): Concept stores are full-blown branded Pandora stores which only carry Pandora products and displays.


2) Other: other points of sale consist of “shop-in-shops” which are clearly defined spaces in other stores (think a little kiosk in an airport Duty-free) that only carry Pandora products and 3rd party distributors which can be either multi-branded retailers or non-branded retailers.


Pandora currently gets 66% of its sales from Concept Stores (plus online) and 34% from “other.”


We’ve discussed where the company sells and how they sell……..but What do they sell?


Pandora is the world leader in charms and charm bracelets. It’s their bread and butter. It’s estimated they own about 30% of the charm market and 75% of their revenues are generated from this category. Estimates are that charms and charm bracelets make up only 6% of the total jewelry market. In essence, Pandora sells you a bracelet for somewhere between $80-150 and then you fill the bracelet up with charms that are $50-150 each. Pandora sells 73 million charms per year (200,000 per day) and 14.5 million bracelets per year (40,000 per day). Pandora’s brand and leadership position in the charm niche is by far its most important asset.

Durability


  The most prevalent risks to the durability of the company are a decline in the popularity of charm bracelets or a
Read more
Geoff Gannon May 2, 2018

Entercom Communcations (ETM): The Second Largest Radio Station Owner in the U.S. Trades at a Lower EV/EBITDA Than its Debt Laden Peers

Member write-up by Vetle Forsland


Introduction


Entercom Communications (ETM) is an American radio company founded in 1968 by the Chairman Emeritus Joseph Field. He alone represents 21.8% of the total voting power, while his son, CEO David Field, represents an additional 6.2% of the voting power. For years, Entercom operated as a top five radio broadcaster. In the fall of 2017, when they acquired the much larger CBS Radio through a Reverse Morris Trust merger, ETM became the second largest radio broadcasting company in the US.


A special situation always interests me, and this particular merger was interesting primarily for one reason: the former CBS shareholders would own 72% of the new ETM stock. Since the former CBS shareholder never actively sought out a position in Entercom, many shareholders would be pressured to sell their stock, which explains why ETM has dropped from about $12.20 per share to $10.50 today. In my opinion, the stock trades at a significant discount to its fair value, as the market believes the recent struggles of several radio companies have been caused by a bleak radio industry, although the real reason has been over-leverage and poor management.


Business overview – is radio dying?


Entercom operates 235 stations in the mid-and-top tier cities of the US. They reach over 100 million monthly listeners, and generate revenue from the sale of broadcast time to advertisers. They sell ad time to local, regional and national advertisers. The largest portion of revenues comes from local, in which each station’s local staff generate ad sales, while the rest is handled on a national basis. Radio is a capital-light business, which is mirrored in their 5-year average EBITDA margin of 25.1%. It is also very asset-light, as 75% of their assets come in form of licenses and goodwill. Furthermore, the company is the second largest podcaster in the market, owns Radio.com (a website for music news) and generates revenue from organizing festivals, concerts and other live events.


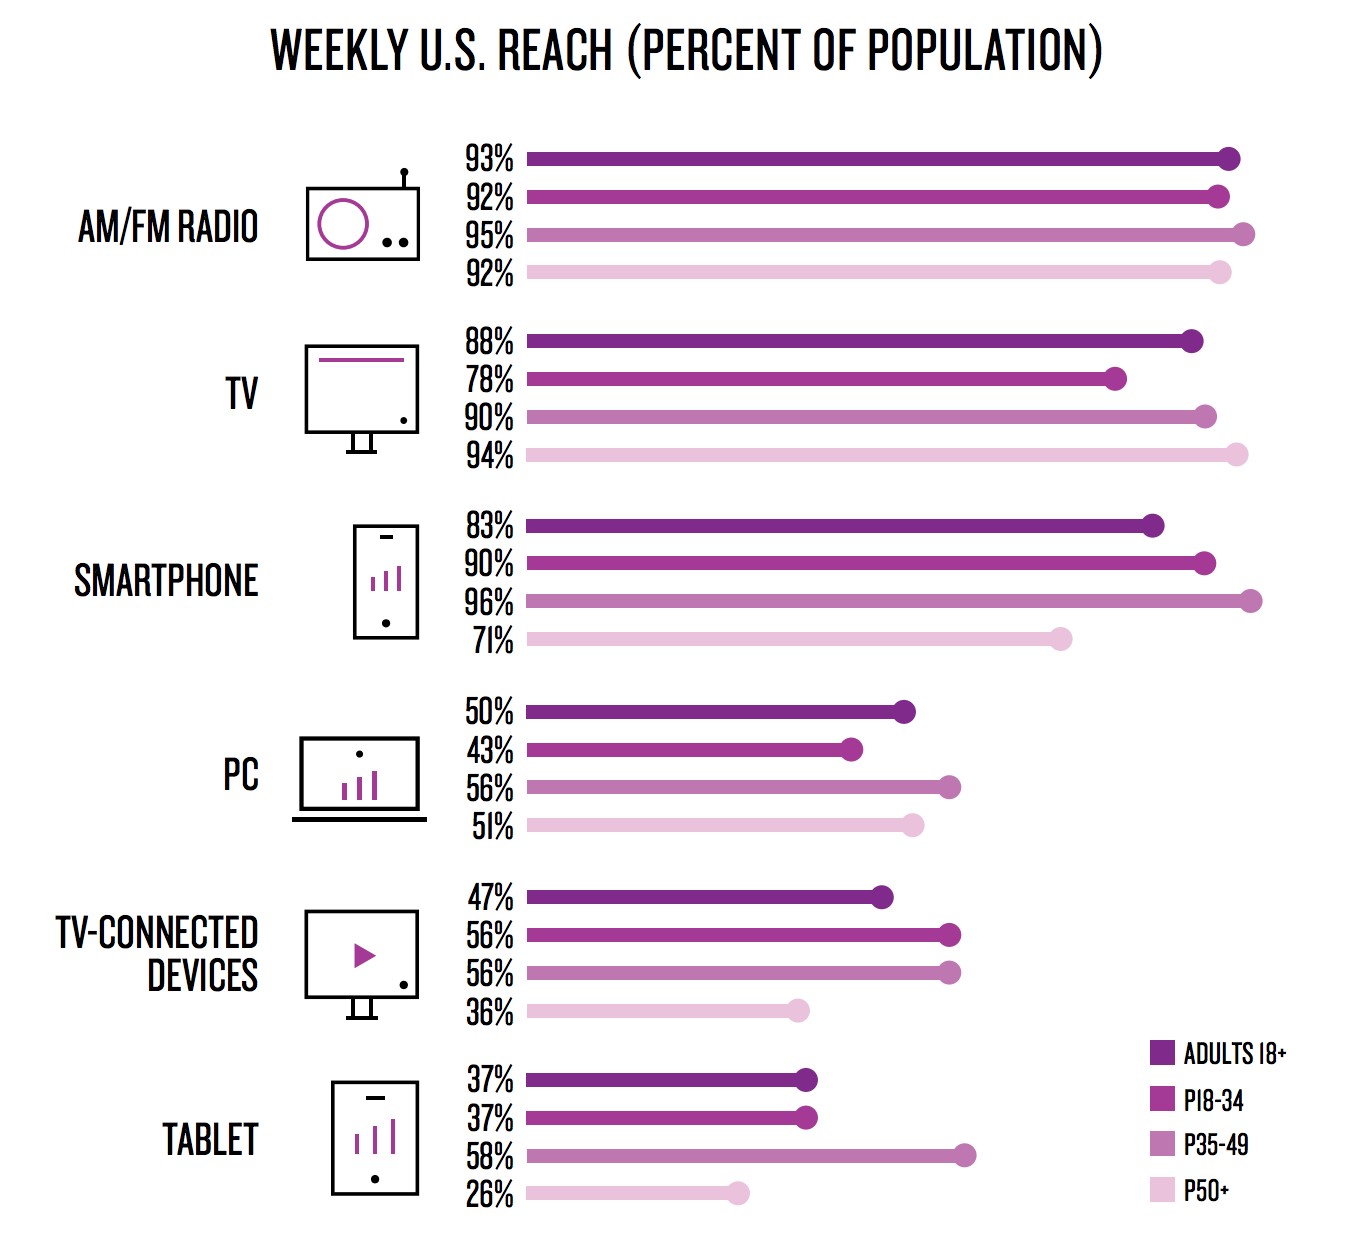
Since they get almost all of their revenues from radio broadcasting, the prime concern is whether or not radio will stay intact over the next decades. At a first glance, it might sound like a dying medium in a world of Spotify and YouTube, but research completed by reputable firms shows the opposite. For instance, research conducted by Nielsen, a company with 44,000 employees, show that radio reaches more Americans each week than any other platform. Radio reaches well over 90% of the US population, compared to just ~85% for smartphones and the same for television. Furthermore, the amount of weekly listeners has increased over the past three years and ten years.


Radio also offers a high return on capital for advertisers, as compared to other mediums. Procter & Gamble recently stated that they are spending “more and more” on radio advertising and declared a $100 million investment in digital ads “largely ineffective”. It wouldn’t surprise me if other major companies will mirror the actions of Procter, which …

Read more
Geoff Gannon April 15, 2018

Computer Services Inc. (CSVI): An Unlisted, But Super Predictable Company Trading at an Unleveraged P/E of 15 times Next Year’s Earnings

Member write-up by Jayden Preston


Introduction


Computer Services Inc (often called “CSI”, the ticker is CSVI) is an unlisted stock in the US. It does not file with the SEC. But it does trade over the counter. The Company also publishes annual reports and quarterly earnings reports. You can find more information about the Company on OTCmarket.com.


As you would expect from an unlisted company, their annual report is not as extensive as you would find in a 10K. However, there are financial figures of the Company going back to 1996. There are also three main comparable companies that are listed. So, you can gather enough information to make an educated judgement on the Company.


CSI provides service and information technology solutions to meet the business needs of financial institutions and corporate entities. Their main clients include community banks, regional banks, multi-bank holding companies and a variety of other enterprises. They emphasize that their services are tailor-made to the clients’ needs.


The Company categories their revenue sources into two major parts: 1) core processing and 2) integrated banking solutions. Below I quote from the annual report on the range of services they offer:


“We derive our revenues from processing services, maintenance, and support fees; software licensing and installation fees; professional services; and equipment and supply sales. In addition to core processing, our integrated banking solutions include digital banking; check imaging; cash management; branch and merchant capture; print and mail, and electronic document delivery services; corporate intranets; secure web hosting; e-messaging; teller and platform services; ATM and debit card services and support; payments solutions; risk assessment; network management; cloud-based managed services; and compliance software and services for regulatory compliance, homeland security, anti-money laundering, and fraud prevention.”


As you can see, their solutions cover a very wide range of operational needs of financial institutions. They are almost like an outsourced IT department for financial institutions, with many functions they provide being highly critical.


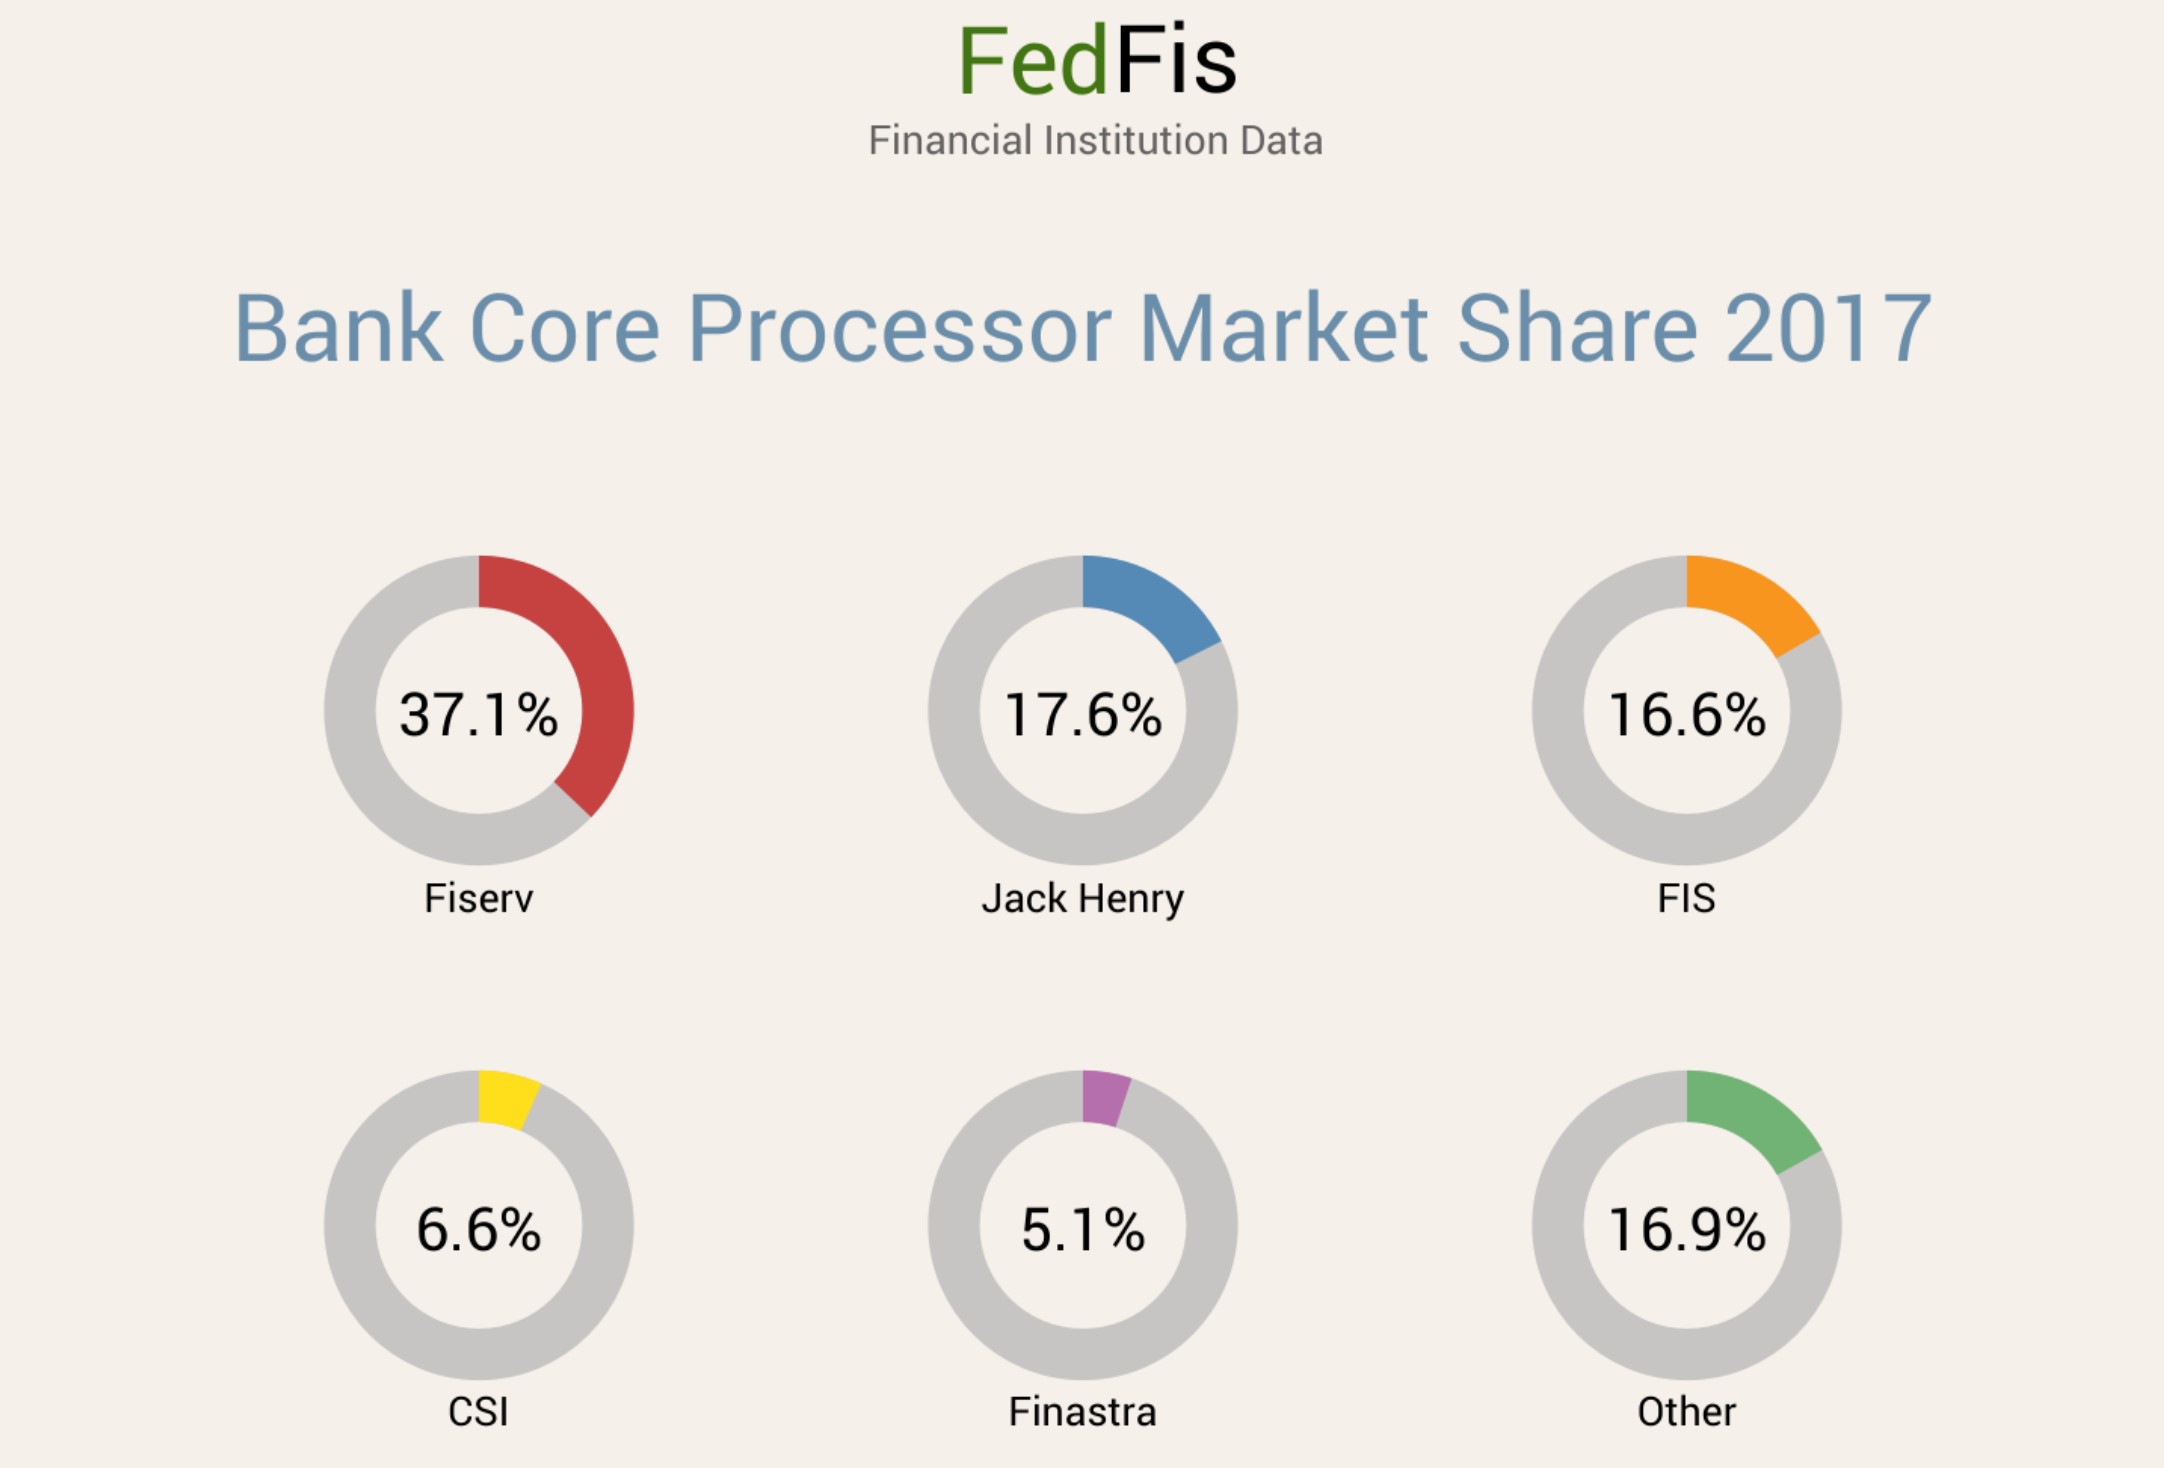
Within the bank core processing industry, CSI is a distant fourth player, with a market share of 6.6% in 2017. The biggest player is Fiserv, with 37.1% of the market. The next two players are Jack Henry and FIS, with market share at 17.6% and 16.6% respectively.


Durability


For the business of core processing and other bank IT services to be durable, two key conditions are needed: 1) Financial institutions, such as banks and credit unions, remain durable and 2) Outsourced solutions continue to be an option.


Historically, banks are some of the most durable businesses. Now, with cryptocurrencies being all the rage, there are people who will question whether banks will remain durable. That is too big a topic to discuss in full here. But in short, my personal thought is it is too speculative to believe bitcoins will take over the whole banking industry. A more reasonable scenario to me is the blockchain technology will be incorporated within the current banking system instead.


As …

Read more
Geoff Gannon March 30, 2018

ExxonMobil (XOM): A Blue-Chip Energy Company Likely to Provide Double-Digit Returns

Member write-up by Trey Henninger


Exxon Mobil (XOM) is one of the oil majors. Traditionally, being an oil major has meant being a fully vertically integrated company from oil exploration, drilling, refining, and chemical production. ExxonMobil continues to fulfill that role, but they are much more than an oil company today. Although they are typically billed as an oil AND gas company, they are much more.


Business Model Overview


ExxonMobil is a very complicated business with many different parts. The simple way to look at the business is that ExxonMobil operates as a vertically integrated company. They source and sell commodity products. Since ExxonMobil’s focus is in commodities, they have no general pricing power in the market.


Consequently, Exxon’s profits are quite cyclical, and hard to predict. However, the vertically integrated nature of the company dampens the cyclicality of the business cycle to a large degree. When oil prices are low, refining margins are usually high. Alternatively, the chemicals business could continue to make a profit while both oil sourcing and refining are less profitable.


This vertical integration and diversified structure is the key advantage of ExxonMobil and the other oil majors.


Durability


I believe that ExxonMobil is a company with infinite durability. The company traces its history back to the original days of Rockefeller and Standard Oil of New Jersey. Exxon has been in continuous operation for over 100 years. You should be able to expect them to continue to operate for at least another 100 years. At a minimum, well beyond your investment time horizon.


The reason for this is quite simple. Although ExxonMobil’s business is currently focused on the commodities oil and natural gas, that won’t always be true.


ExxonMobil is best analyzed as an “Energy” company.  While the individual commodity product might change, the overall goal is the same.  ExxonMobil is in the business of providing energy to their customers. Currently, this takes the form of oil and gas, but they certainly are not limited to that.


ExxonMobil was originally simply a diversified oil company. Then, as the market changed as natural gas become a larger portion of our energy sources, ExxonMobil acquired a major natural gas company, and has become one of the world’s largest natural gas producers.


The same will occur if the mix of energy ever shifts again in the future. Currently, the thought is that renewables, such as solar or wind power will disrupt the oil majors, such as ExxonMobil. This is not likely to happen. Instead, I would expect ExxonMobil to operate in the oil and gas business until they recognize that renewables are finally ready for the mainstream. Once they do, they’ll acquire a major renewable energy company, and quickly build it up. It won’t be long before ExxonMobil is then one of the largest renewable energy producers on the planet.


ExxonMobil has both the scale and the financial resources to accomplish this goal.


Competition


ExxonMobil …

Read more
Geoff Gannon March 30, 2018

EM Systems: The Japanese Industry Leader in Pharmacy Software

Member write-up by Clayton Young.


Thinking Points

  • EM Systems (TSE: 4820) is an industry leader in pharmacy software looking to leverage its strengths in closely related industries.
  • The company’s biggest strength is its business model, which lowers industry standard system implementation costs and better aligns cost structure to its customers’ operating performance.
  • Share price is a little elevated today at 1,398 yen per share (13.8 TTM EV/EBIT). Investors can reasonably expect an investment CAGR between negative 2.5% and 8.8% over the next three years.

Introduction

EM Systems (TSE: 4820) primarily develops, sells and maintains software geared for pharmacies. With a 26% domestic market share, the company is an industry leader. More recently, EM Systems started focusing on Medical systems (Electronic Health Record) and Nursing Care systems. By the end of fiscal 2019 (March 2019), the company aims to achieve market shares of 40% in pharmacy software, 10% in Medical systems, and 5% in Nursing Care systems.

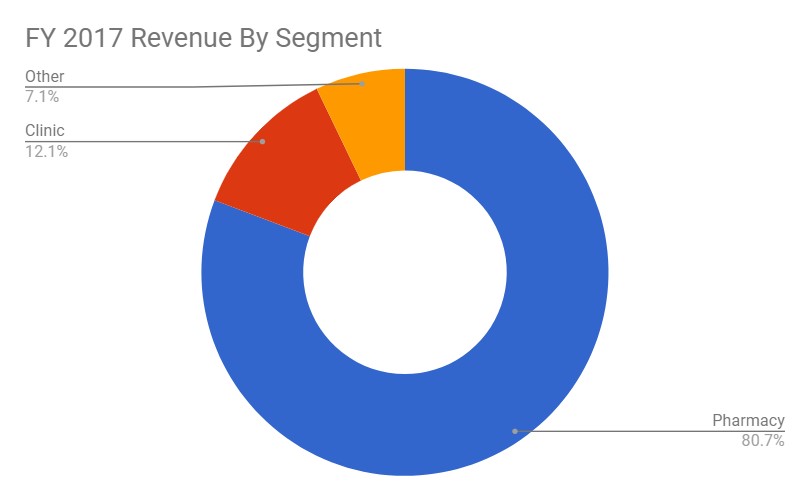
The company has three reporting segments: Pharmacy, Clinic (Medical system), and Other (includes Nursing Care system).

During the fiscal 2017 reporting period, 81% of revenues and virtually all of operating profit came from the Pharmacy segment.

Source: Author calculation based on EM Systems filings


Long-time Value Investor’s Club (VIC) members may be familiar with EM Systems. The company was covered on two occasions: Once in 2015 and again in 2017. I highly recommend reading both before proceeding, as I am hoping to fill in the gaps rather than repeat the same information.

Industry

Since the Pharmacy segment accounts for 81% of EM System revenues, this section will mostly focus on the pharmacy industry in Japan.

According to MAC Advisory (Japanese), the pharmacy market in Japan was a 7.9 trillion yen ($74.2 B USD) market in 2016. The top 10 pharmacy operators (by prescription revenues) accounted for 15.8% of the industry. 70% of pharmacies were operated by individuals. There are approximately 58,000 pharmacies in Japan.

In November 2017, I briefly covered the convenience store, drug store and pharmacy industries. The post can be found here. With a heavier focus on pharmacies, the highlights are below:

  • The three industries are merging/consolidating.
  • There is an industry-wide shortage of pharmacists, which is expected to continue.
  • Japanese government is pushing for “family pharmacist”, lower prices, and generic drugs.

Though it is tempting to look at Japan’s aging population and invest in pharmacies with a tailwind in mind, the Japanese government has a vested interest in reducing drug prices. With Japan’s universal health care system, all residents are required to participate in the public health insurance program. Participants shoulder a maximum out-of-pocket expense of 30% on government approved prescriptions.

The Japanese government reviews health care costs (including drug prices) every two years. Nursing care costs are reviewed every three years. Every six years, both reviews land on the same year, and 2018 is that year. Japan Times writer Tomoko Otake wrote about the highlights of this year’s health care review, effective April 1. In short, …

Read more
Geoff Gannon March 26, 2018

Why I’ve Passed on Keweenaw Land Association (so far)

Trey had a good question in response to my Keweenaw Land Association article:

“Are you willing to share your reason for not investing at this time?

My first pass analysis leads me to also not choose to invest at this time. For me, it’s a matter of opportunity cost. Simply beating the S&P500 is insufficient. Since the S&P500 is projected to return much lower than its historic rates of return, my current opportunity set is much better.

That’s really always been my hesitation with owning something like timberland. I’ve been interested for diversification reasons, but in order to achieve double digit returns over long periods of time, you have to really buy at a large discount.

While I agree with the analysis that downside looks limited here, I struggle to come up with a scenario where a long-term owner (10+ years) could earn 10%+ returns. I understand though, that if the company is sold in a shorter amount of time for a premium, you could earn that hurdle rate over a shorter period of time. With that said, I think purchasing below $75-80 per share would offer the additional 2%/year return that I need for a 10 year holding period.

Sure. So, it’s easy to imagine a scenario where a long-term holder of timberland makes 10% plus returns. All you need is high inflation. Timberland’s long-term returns should be driven by: the cash flow produced by the annual harvest, the biological growth, the rate of inflation, and then also there tends to be some return – at least historically this has been true as countries develop – of competing uses for the land. This last factor is not important in Upper Michigan. But, there are places in the U.S. where it is. There’s nothing nominal about any of the factors driving returns in timberland. All the factors driving returns are real factors. So, if you had 6% inflation or higher – it’s likely timberland would return 10% or more a year for as long as that situation continued. You can check the historical record for periods of high inflation in the U.S. and see how timberland performed versus stocks, bonds, commodities, etc. during that period. The answer is good.

Over periods as short as 5-10 years, the factors driving timberlands returns would really just be the purchase price you were getting in at (if you’re buying a timber stock – this means both where we are in terms of timberland pricing and where the share price is versus the appraisal value of its timberland) and then whether demand for housing increases while you hold the timber stock. There are other uses for timber, but the most cyclical use for the more profitable trees is housing. So, when you see a low projected return for the S&P 500 versus a high projected return for timberland over the next 5 or 10 years, what the forecaster is really saying is: stocks are relatively more expensive than timberland right now, home construction …

Read more
Geoff Gannon March 22, 2018

Keweenaw Land Association: Buy Timberland at Appraisal Value – Get a Proxy Battle for Free

Keweenaw Land Association (KEWL) is an illiquid, unlisted stock. It trades something like $15,000 to $20,000 worth of stock on an average day. The company does not file with the SEC. However, you can find plenty of information – including investor presentations, annual reports, quarterly reports, and other news – at the “company reports” section of Keweenaw’s website. You can also find news about the company – including press releases from a 26% shareholder who is trying to take control of the  board – at Keweenaw’s OTCMarket.com “News” page.

Keweenaw Land Association owns timberland in Upper Michigan. It has 185,750 acres of timberland and 401,841 acres of mineral rights. The difference between those numbers – 216,091 acres of mineral rights – is “severed” mineral rights where Keweenaw sold timberland without selling the mineral rights on that land.

The company has 1.3 million shares outstanding. So, each shares of Keweenaw Land Association is essentially made up of 0.14 acres of timberland, 0.31 acres of mineral rights, some cash, some marketable securities, and some debt. Of those assets and liabilities – it’s the 0.14 acres of timberland that matters most. Unlike many of the big, publicly traded timber companies, Keweenaw Land Association is not a REIT. However, the current board has said they plan to convert to a REIT for tax year 2018.


First Let’s Deal with the Catalysts: 3 Weeks till a Contested Proxy Vote, REIT Conversion, Copper, etc.

I say “current board”, because Keweenaw is in the middle of a proxy battle that will decide board control at the April 12th vote. So, there is a catalyst here. Control of the board might flip 3 weeks from today. The party contesting the election is Cornwall Capital. Cornwall has 2 of 8 board seats right now. They are contesting 3 board seats at the April 12th election. If they win all 3 board seats, they will have a majority (5 of 8) board seats. Cornwall Capital is a long-term holder of the stock. I believe they have held Keweenaw shares for about 10 years. The firm is run by Jamie Mai (who already sits on Keweenaw’s board). Cornwall Capital owns 26% of Keweenaw’s shares outstanding. Jamie Mai was mentioned in Michael Lewis’s “The Big Short”. The Paul Sonkin that Cornwall is running on their ticket for the April 12th vote is the nano-cap/micro-cap investor who used to run Hummingbird Value, works at Gabelli, and co-wrote one of Bruce Greenwald’s value investing books. I don’t have much of an opinion on this board vote, the nominees, etc. I just thought it was worth mentioning that if you – as a value investor – are thinking the names Jamie Mai and Paul Sonkin sound familiar, it’s likely because you read “The Big Short” and “Value Investing: From Graham to Buffett and Beyond”.

Another potential catalyst is that Keweenaw could convert to a REIT. The board had previously said this was a bad idea. Now, they say they’ll do …

Read more
Geoff Gannon March 22, 2018

Fairfax Financial Holdings: Large Upside Potential with Minimal Downside

Member write-up by: Alex Middleton


Introduction

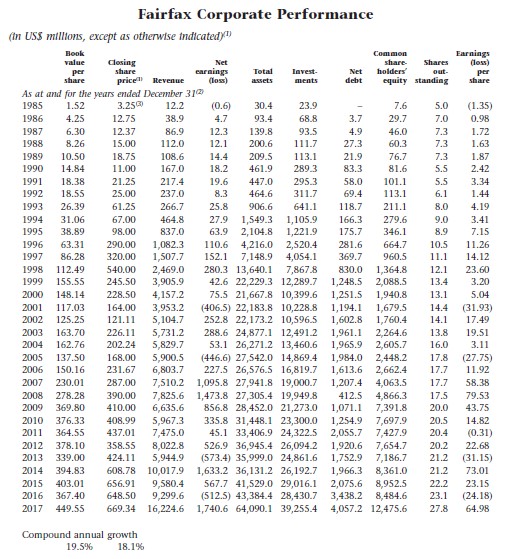
 In the past 10 years Fairfax Financial has achieved what can easily be considered sub part returns, however I believe that the company will outperform the S&P significantly in the next 10 years as a result of the improved rate of return on their investment portfolio and a multiple expansion on their stock.  One of the main reasons that their stock is undervalued today is because people are anticipating that Fairfax’s growth will underperform in the future as it has in the recent past.  Fairfax’s entire history however tells a different story.  From 1985 to 2017 Fairfax achieved a compound annual growth rate of 19.5% on their book value (Source: 2018 Annual Report).  This is a tremendous achievement over the span of 3+ decades which many people seem to forget.  Fairfax has (until recently) been heavily hedged against equities, at a time the S&P continued to grow to unprecedented levels year after year and this underperformance is still very fresh in people’s memories.

The hedging has always been justified by Fairfax management by reiterating their goal of protecting shareholders capital against (what they perceived) as a major risk of deflation in the global economy, which was not entirely unreasonable given how much money the Federal Reserve injected into the economy post 2008.   Over the course of the past 10 years Fairfax has been quietly building their set of tools to take advantage of the next big opportunity that the market offers them. From 2008 to 2017 they have managed to compound their investments per share by 2.4% and compound their book value by 5.4% per year. At today’s price you are paying approximately 1.1x book for the business.   In this article I will summarize why I believe Fairfax is a very good investment opportunity for investors today.


Investment Portfolio

Fairfax’s current investment portfolio is comprised of a combination of book value, debt and insurance liabilities (float) and is worth $39.2 billion as of Q4 2017  (Source: 2018 Annual Report).  This amount currently works out to $1412 per common share ($1250 per common share less debt and goodwill) where about $819 per common share is made up of their insurance float (Source: 2018 Annual Report).  When a value investor finds opportunities to put this amount of money to work at a decent return, the relative impact on shareholders’ equity can be dramatic.  Recently Fairfax has  removed a considerable amount of their equity hedges from their portfolio and is now sitting with about 50% of their investments in cash.  As with many other value investors who are expecting the next big opportunity in stocks to come in the near future, this sort of “war chest” is exactly what they need in order to surpass their previous 10 years investment performance.

In this year’s shareholders letter Prem Watsa had indicated that buying back shares would be done more aggressively in the future than in the past.  At today’s stock price of $495 or 1.1x book value and …

Read more
Skip to toolbar