Posts In:

Geoff Gannon February 27, 2020

How Can Long-Term Value Investors Make the Most of This Week’s Short-Term Volatility?

Andrew and I just did a podcast about volatility. And, of course, when we say “volatility” I want to remind everyone that’s a codeword for “downside volatility”. Nobody minds upside volatility. There are basically two topics worth discussing when it comes to volatility and how you as an investor should behave. One is how to “handle” volatility – psychologically and such. The other is how to take advantage of volatility. If we go back and think about Ben Graham’s Mr. Market metaphor – it’s really all about volatility. Mr. Market’s existence really only benefits you if he is giving you wildly different quotes over some period of time. Sure, it doesn’t have to be day-to-day. But, if all stocks are rising by similar, gradual amounts over time – a public quote for your shares doesn’t give you much benefit in selling one thing and buying another. You need either relative moves among stocks – where you own an airline stock down a lot and a healthcare stock that’s rising in price – or you need very different quotes on the same stock depending on the day. There’s an old article (but a good one) up on the Focused Compounding site that talks about the concept of “value trading”. This is where a value investor owns maybe 5 stocks he really likes for the long-run. But, in any given year – one of these stocks will rise a lot closer to his estimate of intrinsic value while others will fall. For example, Warren Buffett’s stock portfolio at Berkshire Hathaway rose something like 40% last year. Obviously, the underlying business’s earnings power barely budged. Maybe it rose 5%. Maybe not even that. You’ll notice that Berkshire’s wholly owned businesses didn’t have any increase in their operating earnings. I think Berkshire’s partially owned businesses did a lot better. But, they didn’t do 40% better. So, in a year like that, you have some of your stocks rising a lot closer to your estimate of intrinsic value while others don’t. The obvious example at Berkshire of a stock that rose far faster than its intrinsic value last year would be Apple (AAPL).

Now, Buffett can’t “value trade”. Or, at least, he shouldn’t try to. Buffett has to put more and more cash to work each month, quarter, and year. If he sells any of his Apple stock – he has to find somewhere else to put it. And, because he owns such big chunks of the public companies he’s in – that’s a problem. This is a problem even for much smaller investors. Andrew and I run a fund where we have allocations to specific stocks that are in part based on how much of the fund we’d like in those stocks – but, also partially based on simply how much of those stocks we can own. This issue mostly crops up when a fund has more assets under management than the market cap – or, at least, the “float” – of the company …

Read more
Geoff Gannon February 24, 2020

The “Element of Compound Interest”: When Retaining Earnings is the Key to Compounding and When it Isn’t

In my first two articles about Warren Buffett’s letter to Berkshire Hathaway shareholders, I talked about Berkshire’s year-by-year results as a stock and about Warren Buffett’s approach to holding both stocks and businesses. Today, I want to talk about a very interesting section of Buffett’s letter that doesn’t (directly) seem to have all that much to do with either Berkshire or Buffett. This section starts with the name of a man Buffett has mentioned before “Edgar Lawrence Smith”. It also mentions a book review Buffett has mentioned before. In 1924, Smith wrote a book called “Common Stocks as Long Term Investments”. Keynes reviewed that book. He said two very interesting things in that review. The one Buffett quotes from this year goes:

“Well-managed industrial companies, do not, as a rule distribute to the shareholders the whole of their earned profits. In good years, if not in all years, they retain a part of their profits and put them back into the business. Thus there is an element of compound interest operating in favor of the sound industrial investment. Over a period of years, the real value of the property of a sound industrial is increasing at compound interest, quite apart from the dividends paid out to the shareholders.”

This is obviously the most important concept in stock investing. It is the entire reason why stocks outperform bonds over time. Investors – even after this book was published – tend to overvalue bonds and undervalue stocks. Academics call this a “risk premium” for stocks. But, on a diversified basis – it doesn’t make a lot of sense to say it represents long-term risk. It does represent volatility. It also represents uncertainty as to the exact size of performance and the timing of that performance. But, in most years, there really hasn’t been a lot of uncertainty that a 25-50 year old putting his money 100% into stocks will end up with more value when he’s 55-80 than the 25-50 year old putting his money 100% into bonds. The market doesn’t usually undervalue the dividend portion of stocks. Sometimes it does. There have been times – most a very, very long time ago – where you could buy a nice group of high quality stocks yielding more than government bonds (and even less commonly, corporate bonds). To this day, individual stocks sometimes do yield more than bonds. I can think of a few countries (a very few) where you can buy perfectly decent, growing businesses yielding more than the government bonds in those countries (though this is usually due to very low bond yields, not very high dividend yields). And I could think of a few stocks that yield more than some junk bonds right now. But, there’s an important caveat here. The stocks that seem safe and high yielding retain very, very little of their earnings and grow by very, very low amounts. In other words, the element of compound interest is often smallest in the stocks with the highest …

Read more
Geoff Gannon February 23, 2020

How Buffett Holds: The Incredible Importance of the “Contrasting Trajectories” of Long-Term Winners and Losers

In my first article about Warren Buffett’s annual letter to Berkshire Hathaway shareholders, I talked about how difficult it would’ve been to hold Berkshire stock during all the years when it rose so much so fast. That’s one underappreciated part of how successful Berkshire has been as an investment. Buy and hold often sounds like a simple strategy to follow. Berkshire has returned 20% a year compounded over more than 50 years. It would’ve been easy to hold the stock if it rose 20% a year every year. But, sometimes it got far ahead of itself – jumping 100% or more in price in a single year. And then, other times, the stock price lagged the intrinsic value gain for several years in a row. But, the long-term trend in Berkshire Hathaway’s results was one of compounding at about a ten percentage point a year advantage over the S&P 500. Today, I want to talk about a different underappreciated aspect of Berkshire’s compounding. Yesterday, we talked about how uneven the compounding was over time. Today, we’re going to talk about how uneven the compounding is in terms of sources.

Berkshire’s results are fueled a lot by its insurance operations. As an insurer, Berkshire tends to turn an underwriting profit. This gives Buffett a cost free form of money called float. Berkshire uses some of this float to invest in stocks and to buy entire businesses. The company uses its retained earnings to finance the rest of these two portfolios – one made up of private businesses 100% owned and the other made up of minority stakes in publicly traded companies. The underappreciated part of what Buffett does that we’ll be talking about today is exactly how he buys these businesses and these stocks. How he buys businesses is pretty normal. Most acquisitions done by big U.S. companies are done the same way. You buy basically 100% of a company using a combination of debt you raise, cash you have on hand, and maybe (Berkshire does this only occasionally) shares of your own stock. You make the purchase at one single point in time. Sometimes you might draft some kind of earn-out agreement where the former owners (who often stay on to manage the business you now own) make more money if the business they sold to you hits certain targets over the first few years you own it. But, that’s a very small part of the overall purchase price. We can simplify this by assuming you pay “x dollars” for the stock upfront in cash and then hold the business forever. That’s how most acquisitions work.

What a lot of investors don’t appreciate is that Buffett runs his stock portfolio a lot like he runs his stable of 100% owned businesses. Buffett buys and holds his shares in a company in a totally different way from almost any other investors out there. And this has some pretty big implications when it comes to just how the compounding of his …

Read more
Geoff Gannon February 22, 2020

Ask Yourself: In What Year Would You Have Hopped Off the Warren Buffett Compounding Train?

Warren Buffett’s annual letter to Berkshire Hathaway shareholders was released today. It starts – as always – with the table comparing the annual percentage change in Berkshire Hathaway with the annual percentage change in the S&P 500 with dividends included. Long time readers of the Buffett letter will remember when the change in book value of Berkshire Hathaway was included. That’s been removed. We are left with the change in per-share market value of Berkshire Hathaway.

Today, I’m just going to focus on this table. Over the next few days, I’ll talk about a few different parts of Buffett’s letter I found interesting. But, one of the most interesting pages in the letter is the very first one. The one with the table showing Berkshire’s performance vs. the S&P 500.

What’s notable about this table? One, Berkshire has outperformed the S&P 500 by about 10% a year over more than 50 years (1965-2019). Berkshire has compounded its market value at about 20% a year while the S&P 500 has done 10% a year. What’s also notable is the many very big years for Berkshire as a stock. On my print out of the letter, I circled some years that stood out to me. Basically, I just assumed that it’s incredibly rare for the S&P 500 to ever have a return of around 50% a year. Generally, an amazing year for the S&P 50 would be one like what we saw last year (up something over 30%). If you are completely in the S&P 500 index, your portfolio is not going to have up years of 40%, 60%, or 120%. Berkshire’s stock price sometimes does go up that much. Or, rather – it sometimes did. It hasn’t lately.

Berkshire had amazing up years – as a stock, these don’t necessarily match up with business results – two times in the 1960s, three times in the 1970s, three times in the 1980s, twice in the 1990s and then never again since the late 1990s. Berkshire’s stock has gone over 20 years with no what I’d call amazing up years. Any good year Berkshire has had as a stock in the last 20 years has been the kind of up year an index like the S&P 500 is also capable of. This obviously tamps down on Berkshire’s long-term performance potential. Most stocks that have amazing long-term compounding records will achieve those records with a bunch of short-term upward spurts in their stock price like Berkshire had in the 1970s, 1980s, and 1990s. In the last 20 years, Berkshire has had several years where returns were in the 22-33% range. Those are great years. But, they are years the S&P 500 is also capable of having (it was up 32% last year). The disappearance of these very big up years – the “lumpy” outperformance – in Berkshire as a stock explains a lot of why the stock performed so well versus the S&P 500 for its first 30 years under Buffett and so much …

Read more
Geoff Gannon February 20, 2020

Gainsco (GANS): A Dark Nonstandard Auto Insurer That’s Cheap Based on Recent Underwriting Results

Gainsco (GANS) is a dark stock. It does not file with the SEC. However, it does provide both statutory (Gainsco is an insurer) and GAAP financial reports on its website. These reports go back to 2012 (so, covering the period from 2011 on). Not long before 2011, Gainsco had been an SEC reporting company. Full 10-Ks are available on the SEC’s EDGAR site. Anything I’ll be talking about with you here today about Gainsco’s historical financial performance has been cobbled together through a combination of GAAP financials for the holding company (Gainsco), statutory financials for the key insurance subsidiary (MGA), and old 10-Ks.

Before I even describe what Gainsco does, let’s start with the company’s combined ratio.

An insurer’s combined ratio is the flipside of its profit margin. However, it covers only the underwriting side of the business. It ignores investment gains on the float generated by underwriting. A combined ratio of 100 means that economically the insurer is getting use of its float at no cost. A combined ratio above 100 means the float costs the insurer something. A combined ratio below 100 means the insurer is making a profit even before it invests the float. The combined ratio has two parts. One is the loss ratio. The other is the expense ratio. These ratios are calculated as fractions of the premium revenue the insurer takes in. So, the loss ratio gives us some idea of how much higher the insurer is pricing its premiums than actual losses will be. For example, a loss ratio of 75% would indicate the insurer priced premiums at about $1.33 for every $1 it lost (100%/75% = 1.33x). The expense ratio gives you an idea of how much of premiums are eaten up immediately by things like commissions, marketing, and a lot of the fixed costs of running an insurance operation. It’s everything other than the stuff that relates to losses.

Here is Gainsco’s combined ratio from 1998-2018 (excluding 2010):

1998: 134%

1999: 99%

2000: 124%

2001: 163%

2002: 143%

2003: 105%

2004: 97%

2005: 95%

2006: 108%

2007: 98%

2008: 99%

2009: 100%

EXCLUDED

2011: 99%

2012: 103%

2013: 99%

2014: 96%

2015: 99%

2016: 99%

2017: 94%

2018: 94%

Something obviously changed there. Till about 2004, Gainsco did other things besides “nonstandard” auto insurance. For the last 15 years, it’s stuck to just writing nonstandard auto insurance in a few (mostly Southern) states.

My guess is that about 80% of drivers seeking coverage in the total U.S. auto insurance market – this might be a bit different in the states Gainsco is in – would be considered standard or preferred risks. So, Gainsco only writes coverage for the bottom 20% of drivers. Gainsco is more of a niche business than just that though. A lot of Gainsco’s policyholders are Spanish speaking. And most are drivers in the states of Texas and South Carolina. My best guess is that Gainsco’s policyholder base is disproportionately made up of: 1) Spanish speaking drivers, 2) …

Read more
Tim Heitman February 5, 2020

Ark Restaurants: Lots Of Hidden Value + Low Liquidity + No Near-Term Catalyst = Excellent Opportunity For Patient Investors

Summary

10% free cash flow yield, 50% being returned as a dividend.

Acquisition of individual restaurants from retiring owners/operators is creating value that is not reflected in the balance sheet/market valuation of the company.

9% ownership in Meadowlands provides free option on the approval of a casino in northern New Jersey.

Operational improvements at remodeled Sequoia restaurant in Washington DC could provide additional improvement in cash flow.

CEO Michael Weinstein owns 27% of the company and is 76 years old. Insiders own 42%. Company rejected $22 per share offer in 2013.

Ark Restaurants

We continue to find small companies that do not screen well on a historical basis but are changing their business model in ways that could generate positive returns that are independent of stock market movements. Ark Restaurants (ARKR) is moving away from owning and operating restaurants under lease agreements and creating value by acquiring individual restaurants from retiring owners/operators. What follows is our analysis of the changes and how investors can benefit from them.

Quick Overview

Ark Restaurants is a unique public restaurant company. It operates large, unique restaurants (typically 200-1000 seats, Olive Gardens are about 250 seats) that are in landmark locations, such as Bryant Park in NYC and the Sequoia in Washington D.C. ARKR also manages restaurants in casinos in Vegas, Atlantic City, Florida and Connecticut. The company’s current restaurant acquisition strategy (four owner/operated restaurants for $31M over the last five years) avoids bidding competition by acquiring, for cash, restaurants and the land underneath from owners/operators looking to retire. They utilize their management expertise to improve operations, resulting in acquisition multiples of 2-4X cash flow. The ownership of the land provides long-term control of the location and option to monetize it in the future. The company pays approximately 50% of free cash flow as a dividend (5% yield). Insiders control 41% of the company’s stock and three institutions control another 20% making the stock highly illiquid, which we view as a positive. The company owns 9% of the Meadowlands racetrack in New Jersey, providing a free option on the eventual approval of a casino at the location.


Reasons for Change in Business Model

Over the last 4-5 years, the company has lost over $6M in EBITDA due to lease expirations that were either not renewed or were too cost-prohibitive to renew. The company has been replacing this lost cash flow by acquiring properties where they also own the buildings and the land (or have a 20+ year lease), eliminating this risk. Changes to minimum wage laws, especially in New York, have pressured payroll expenses and reduced the opportunities to grow in New York City. Payroll expenses as a percentage of revenue have increased from 31.9% in 2014 to 34.9% in 2019. We encourage investors to read the company’s conference calls and shareholder letters. CEO Michael Weinstein goes into great detail on how the lack of tip credits and other factors have harmed the company’s operations. The new acquisition strategy has helped the company

Read more
Andrew Kuhn February 5, 2020

Keywords Studios: A good business with a leading niche in a terrific industry – but perhaps too expensive to buy (for now)

Written by: Vetle Forsland


Introduction

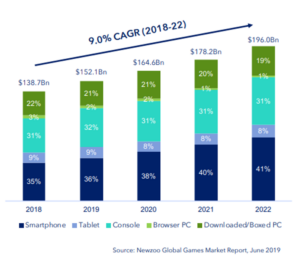
The video game industry is a large and rapidly growing market with revenues projected to reach nearly $200 billion this year, a consistent growth rate in the high single-digits, and over 2.3 billion gamers across the globe. As video games have developed in graphics, gameplay and story, while moving most of the gaming experience online, it has silently become the largest entertainment industry on the planet. According to IDG Consulting, by 2020, the video games industry will bring in more revenue globally than the music business, movie ticket sales and home entertainment combined, after an impressive 26 percent revenue jump from just two years ago. This write-up is centered around Keywords Studios (LSE:KWS), a niche leader set to benefit from all the major developments within this rapidly growing industry.

The Video Game Industry

Major video game releases put Hollywood to shame. While Avengers: Infinity War brought in $640 million globally during its opening weekend, Red Dead Redemption 2, released the same year, generated over $725 million in worldwide sales during its first three days.

How did this happen?

The industry has gone through a big change over the past decade plus. First and foremost, the rise of online gaming, streaming and Esports turned video games from a relatively isolated experience into mass entertainment for everyone to enjoy.

For instance, the 2019 League of Legends World Championship drew 200 million viewers in 2019, more than twice that of the Super Bowl. Major players like Amazon (through its Twitch acquisition), Facebook (Oculus), Snap and Nike are entering the industry. Further, the casual mobile gaming market practically didn’t exist in the 2000s, but generated $38 billion in revenues in 2016, versus $6 billion for the console market, bringing gaming to everyone’s parents and even grandparents. Additionally, in its early history, video games were mostly a single-player activity – but the consoles of the early 2010s made online gaming the main form of gameplay, and together with streaming, turned the industry into something undeniably social.

In the years ahead, the video game market is expected to grow at a strong, consistent CAGR of 9 percent from 2019-2023. This increase is driven by the continued development of higher definition- and complexity games, next-gen consoles coming out in late 2020, and new ways of playing video games – like AR, VR, video game streaming, subscription models – as well as more sophisticated mobile games. It is in this market that Keywords Studios operates, without direct exposure to the successes or failures of individual game titles.

Keywords operates in a niche within the video game market that has grown, and will continue to grow, even faster than the overall industry – specifically the outsourced video game services “industry”, a niche set to continue to expand.

Why?

First of all, the video game industry is trending more and more towards outsourcing important tasks to third-parties, as video game developers experience increased complexity, volume and speed of content generation within competing …

Read more
Geoff Gannon February 5, 2020

Transcat (TRNS): A Business Shifting from Distribution to Services and a Stock Shifting from Unknown and Unloved to Known and Loved

Transcat is an interesting stock for me to write-up, because I probably have a bias here. Quan and I considered this stock – and researched it quite a bit – several years back. We were going to write it up for a monthly newsletter I did called Singular Diligence. All the old issues of this newsletter are in the stocks “A-Z” section of Focused Compounding. And – you’ll notice, if you go to that stocks A-Z section of Focused Compounding – that there’s no write up of Transcat there. I’ve never written about the stock. Why not? Back then, Transcat was a somewhat smaller company with a much, much smaller market cap. It didn’t do the kind of investor relations stuff it does now. Quan and I could read what management was saying and see the company was trying to move from being a distributor of test equipment to being a service company focused on calibration. Quan and I MIGHT have bought the stock for our own personal accounts (I’m not sure we would have, but I am sure we would’ve had an open mind about Transcat). But, those Singular Diligence newsletters were 10,000+ words long. I didn’t see how we could gather enough info on Transcat to write something that long. So, maybe it was a good stock. But, it probably wasn’t a good newsletter issue.

How does that make me biased now?

Well, in the years since I chose NOT to write it up for Singular Diligence – Transcat’s management did what they said they were going to do. The company has now transformed itself from mainly a distributor of handheld measuring equipment to mainly a calibration service provider. I don’t want to overstate this “mainly” part. If you look at each of the last two full years, I think Transcat got something like 48% and then 50% of its revenue, operating profit, EBITDA, etc. from the service segment and about the same amount from the distribution segment. However, looking at this fiscal year – Transcat is only 6 months into it in terms of what it’s reported so far – I’m getting a number for “adjusted EBITDA” (basically, EBITDA with stock compensation added back – Transcat has a lot of stock compensation) that tells me about 60% of the company’s profit is now coming from the service segment. The other 40% is coming from the distribution segment. That didn’t happen entirely due to a revenue spike in services and a decline in distribution. Part of what has happened this fiscal year is something Transcat’s management has been talking about for a very, very long time and only now really started to deliver on: margin expansion.

Margin expansion is probably the key to deciding whether or not to invest in Transcat. Right now, it’s a good and growing business. But, it’s not a great business. The company has never had amazing returns on capital. It does now use some debt (though usually closer to 1.5 times EBITDA in …

Read more
Skip to toolbar