Posts In:

Mister Compounder June 26, 2017

Protector Forsikring (OSLO: PRTOCT)


Ticker:                  PROTCT

Country:              Norway

Stock price:        71,75 NOK


Summary of the thesis:

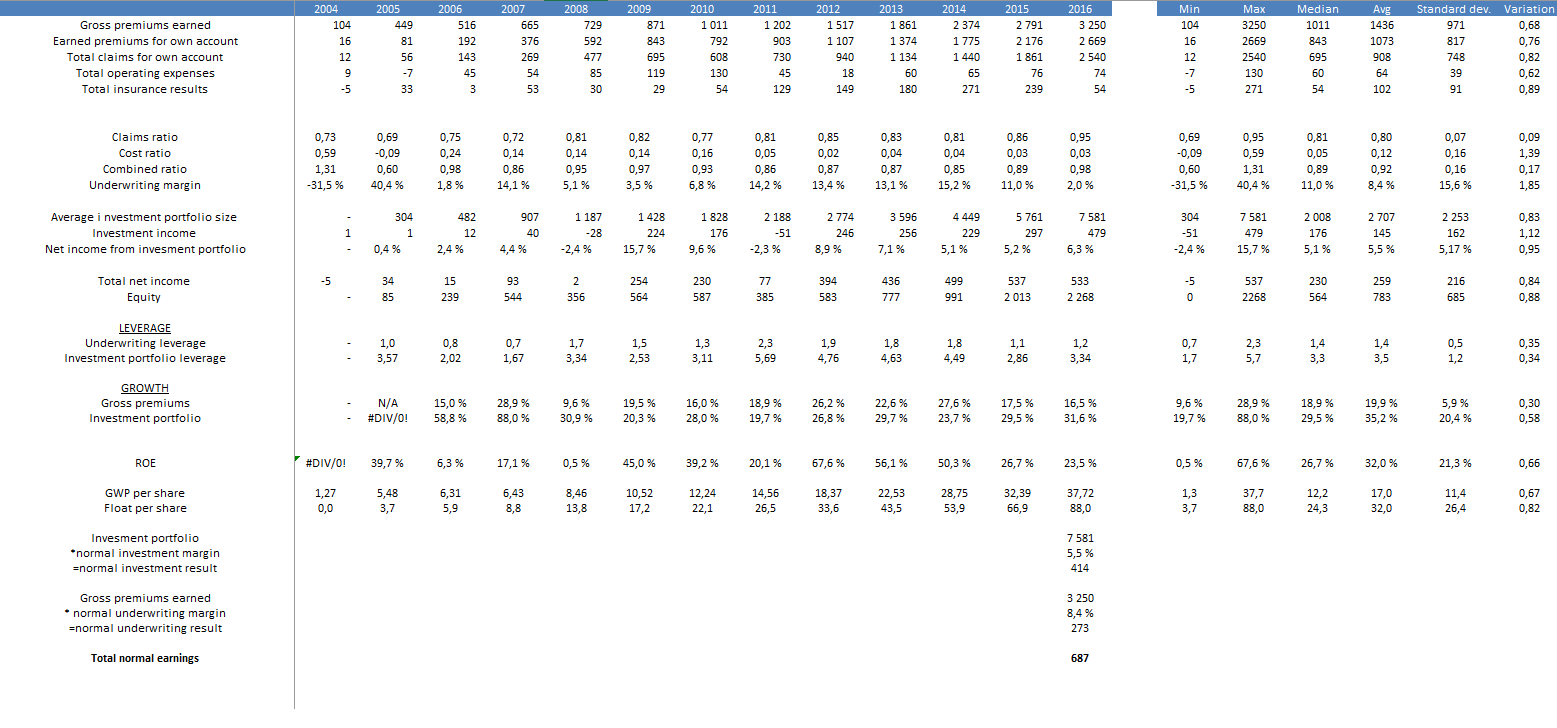
  • A fast-growing Norwegian insurer with higher than industry growth in premiums. Historically it has grown premiums at 20 %, achieving 92 in combined ratio and an investment return on the float of 5,5 %.
  • A low-cost focused business model with industry leading expense ratios.
  • Protector is trading at approximately 12x normal earnings, which is in line with what the Norwegian market has been priced at historically. This is cheap if the growth and the underwriting record can sustained.
  • The risks involve an underwriting business with many moving parts in combination with rapid expansion in new markets. The company has experienced mispricing in its policies like worker’s compensation in Denmark causing the combined ratio to hit 98 for the fiscal year 2016. Furthermore, the investment portfolio consists of 80 % bonds which might not provide an adequate return.

Overview:

Protector is quite a new player in the Scandinavian insurance market. The company was established in 2004, and listed on the Norwegian stock exchange in 2007. It has 300 employees at offices in Oslo, Denmark, Stockholm, Helsinki and Manchester. In 2006, gross written premiums (GWP) was about 500 million NOK, while in 2016 it wrote 3,4 billion NOK in GWP. In other words, this has been a growth story.

Protector consists of three business segments:

  • Selling insurance to companies
  • Selling insurance to the public sector
  • Ownership insurance

And as of today, 56 % of revenues comes from Norway, 24 % from Sweden, 19 % from Denmark, while others amount to 1 % of the business. It has just started expanding into the UK and Protector insures the London boroughs with Royal Borough of Kensington and Chelsea, City of Westminster and Fulham. You might have noticed the big fire in London recently, and the building Grenfell Tower was insured by Protector. The building lies in the west of Kensington and is a typical example of what kind of risks Protector takes on. At least 30 people were sent to hospital with injuries and several were wounded. This was a tragedy for the people, but most of the risks related to the fire was covered by reassurance. The UK market was chosen based on statistical analysis of the expense ratios and competitiveness of insurance markets across Europe.

The long-term financial goals of the company are the following:

  • Growth rate of gross written premium: 15 %
  • Combined ratio for own account: 92 %
  • Return on equity: >20 %

Protector sells their insurance through insurance brokers. Historically, the focus of the company has been to sell insurance to companies in the segment from 100 thousand NOK up to 3 million NOK. In the commercial lines of business, they have 5 000 customers.

Historically, the company sprung out of ownership insurance. This is where Protector also has the strongest market presence, with more than 50 % market share in the Norwegian market. It is sold through lawyers and real estate brokers. However, today, this line …

Read more
Geoff Gannon June 24, 2017

Examining Your Past Sell Decisions: Nintendo

Here is a blogger doing what I recommended: examining one of your past sell decisions…

Blog Post: What I Learned Selling My Nintendo Stock

YouTube Video: Do I Regret Selling Those Stocks?

My Original Post: “Over the Last 17 Years: Have My Sell Decisions Really Added Anything?”

Read more
Geoff Gannon June 24, 2017

All Supermarket Moats are Local

Following Amazon’s acquisition of Whole Foods and the big drop in supermarket stocks – especially Kroger (KR) – I’ve decided to do a series of re-posts of my analysis of the U.S. supermarket industry.

Today’s re-post is a roughly 1,300 word excerpt from the Village Supermarket (VLGEA) stock report Quan and I wrote back in 2014. This section focuses on how the moat around a supermarket is always local.

Read the Full Report on Village Supermarket (VLGEA)

In the Grocery Industry: All Moats are Local


The market for groceries is local. Kroger’s superstores – about 61,000 square feet vs. 58,000 square feet at a Village run Shop-Rite – target customers in a 2 to 2.5 mile radius. An academic study of Wal-Mart’s impact on grocery stores, found the opening of a new Wal-Mart is only noticeable in the financial results of supermarkets located within 2 miles of the new Wal-Mart. This suggests that the opening of a supermarket even as close as 3 miles from an incumbent’s circle of convenience does not count as local market entry.

In the United States, there is one supermarket for every 8,772 people. This number has been fairly stable for the last 20 years. However, store churn is significant. Each year, around 1,656 new supermarkets are opened in the United States. Another 1,323 supermarkets are closed. This is 4.4% of the total store count. That suggests a lifespan per store of just under 23 years. In reality, the risk of store closure is highest at new stores or newly acquired stores. Mature locations with stable ownership rarely close. So, the churn is partially caused by companies seeking growth. Where barriers to new store growth are highest – like in Northern New Jersey – store closings tend to be lowest. Village’s CFO, Kevin Begley, described the obstacles to Village’s growth back in 2002: “…real estate in New Jersey is so costly and difficult to develop. New Jersey is not an easy area to enter. This situation also makes it challenging for us to find new sites. It’s been very difficult for us, and for our competitors, to find viable locations where there is enough land especially in northern Jersey and where towns will approve a new retail center. With the Garwood store…we signed a contract to develop that piece of property in 1992; it just opened last September (2001). So it can be a long time frame from when you identify a potentially excellent site and when you’re able to develop it. Finding viable sites is certainly a challenge that we face, as do our competitors.”

New Jersey is 13.68 times more densely populated than the United States generally (1,205 people per square mile vs. 88). It is about 12 times more densely populated than the median state. This means New Jersey should have about 12 times more supermarkets per square mile to have the same foot traffic per store. The lack of available space makes this impossible. As a result, the number of …

Read more
Geoff Gannon June 23, 2017

Examining Your Own Past Sell Decisions

Check out this video inspired by my “Have My Sell Decisions Really Added Anything” post:

Video

Original Post

You might try the exercise of examining your own past sell decisions.

If you do, feel free to email me about what you learned by examining your own sell decisions.…

Read more
Geoff Gannon June 23, 2017

Can Howdens Joinery Expand to the European Mainland?

Richard Beddard has added Howdens Joinery to his Share Sleuth portfolio. I mention this because I’ve written a little about Howdens Joinery in the past. And some of you know Howdens is the stock I like best that I don’t yet own.

This raises the question:

Why haven’t I bought Howdens yet?

There are two reasons:

1.       I try to buy stocks I’m confident I’d be willing to hold for more than 5 years if necessary

2.       I try to simply hold cash till I’m confident a stock will return at least 10% a year while I hold it

I believe Howdens may – in about five years from now – have fully covered the U.K. with about as many depots as it ever will have in that country. I’m not 100% sure this is true. I’ve seen companies raise their estimates of the size of their chain’s footprint that their home country can support. So, Howdens may have more years of depot growth ahead of it beyond 2022.

But, there will eventually be a limit to how many depots Howdens can build in the U.K. So, the next question is:

Can Howdens expand to other countries?

Richard Beddard writes:

“The other risk is Howdens might fill the UK with depots within my 10-year scenario, in which case it would need to find some other way to grow. Due to its entrepreneurial culture and decade long experimentation with European stores, I think it probably will be able to adapt its business model and establish profitable stores abroad.”

I don’t doubt Howdens’s entrepreneurial culture. But, at the risk of ethnocentrism here (I am an American writing about a British company), I am not 100% certain that Howdens’s entrepreneurial culture will – at the depot level – be easily exportable to non-English speaking countries. I’ve researched a few organizations in the past – notably Tandy Leather (TLF) and Car-Mart (CRMT) – where scuttlebutt taught me the importance of delegation and incentivization of the branch managers.

I believe Howdens’s model depends heavily on good management at the depot level.

As a rule, English speaking countries tend to be among the most “flexible” when it comes to labor in the sense employers can easily fire workers with little cost. And, as a rule, continental European countries tend to be among the least flexible when it comes to labor.

In its 2015 annual report, the company said:

“Managers hire their own staff locally and develop relationships with local builders. They do their own marketing to existing and potential customers. They adjust their pricing to suit local conditions. Managers manage their own stock. They work out where to put everything they can sell – old favourites and new introductions. Every day, they balance the needs of builders, end-users, staff and everyone in their local area who has an interest in the success of their depot…Managers are in charge of their own margin, and effectively of their own business. Both managers and staff are strongly

Read more
Geoff Gannon June 21, 2017

Finding the Right P/E Multiple – Or How to Handicap a Stock

First, a huge warning about the tables I’ll be showing you in this memo. The P/E multiples shown here are useful as a theoretical tool for getting some idea of how important durability – being able to know a stock will still be turning an annual profit more than 5 years from now – and growth (being able to know a stock will compound intrinsic value faster than the overall market) is in finding the right P/E for a stock.

Basically, what I’m saying here is that if literally all you know about a business is that it will grow 5% a year for the next 5 years (and then you don’t even know if it will lose money or not in year six) – you can’t afford to pay anything but an incredibly low P/E for that stock. Likewise, to justify a P/E ratio of 30 or 100 or some number as unusually high as that – you will need to be able to project a stock will not just compound intrinsic value quickly – but that it will continue to compound at above market rates for 15 to 20 years (not just 5 to 10).

As you read this memo, remember those two principles. And remember this is not a magic formula table that tells you – based on past figures – whether a stock is mispriced or not. It’s a thinking tool that tells you if you really are unusually certain about a stock’s long-term compound future, just how much that certainty should change the P/E you’re willing to pay.

For example, it tells you that you really can pay an absurdly high P/E ratio for a stock you are 100% certain will compound value faster than the S&P 500 – if and only if you know that compounding will last for 15-20 years. Knowing that above average growth will last for 5 years isn’t enough.

Now, to today’s question:

“Would be keen to get your thoughts on how you think about what multiple a stock should trade on and also how you appraise a stock’s value. I think multiple is a function of a number of things – earnings growth, durability, industry evolution, reinvestment and earnings retention etc. – but very keen to hear how you think of it. It’s something that I find difficult, particularly for higher quality businesses that are already on high multiples.”

The formula that really matters in investing is simply:

Compounding Power / Price

If you take “compounding power” and you divide by “price” – you should always know which investment to make. If two stocks have the same price, you should always buy the stock that compounds better. And, if two stocks are equal compounders, you should always buy the cheaper stock.

Warren Buffett’s business partner, Charlie Munger, has said:

“To us, investing is the equivalent of going out and betting against the pari-mutuel system. We look for a horse with one chance in two of winning, and that pays

Read more
Kevin Wilde June 20, 2017

Under Armour (NYSE:UA)

UPDATED: 20-JUN-2017

Athletic apparel manufacturers typically develop, market, and distribute their own branded apparel, footwear, and accessories for men, women, and youth.  Products are usually sold worldwide and worn by athletes, as well as by consumers of active lifestyles.  Products are most often marketed at multiple price levels with revenue generated from a combination of wholesale sales to independent and specialty retailers, as well as through direct consumer sales channels that include a company’s own stores and its ecommerce sites.

The key players in the industry are NIKE (includes Jordan & Converse which was acquired in 2003), Adidas (includes Reebok which was acquired in 2005), Under Armour, PUMA, and ASICS.  Below is my estimate of the market size and industry market shares:


The industry is currently benefiting from a number of consumer trends, including an ongoing shift towards living healthier, a shift to more casual work and everyday apparel, global growth in sports activity, and a growing middle class in China and other emerging markets.  Other trends that appear to be affecting the industry are growth in Direct-to-consumer sales and a tendency for consumers to develop brand loyalty at a young age.

The athletic apparel industry is very durable with athletics traced back to 2250 BC.  People often seek to belong to a group and are typically loyal to their favourite athletic brands.  Over the long-term, the industry should be capable of growing sales at rates at least as fast as the global GDP growth rate (ie. ~4.5%+), and faster, if the current trends discussed previously, endure. 

The economic moats of an athletic apparel company is based on its brand strength and how well it resonates with consumers.  Protecting a company’s brand and growing its appeal/popularity is crucial to mass-market success. Endorsement deals with popular sports teams and athletes are often critical to brand success.  NIKE dominates industry endorsement spending, sponsoring 70% of the most valuable sports teams and 45% of the top athletes.  Adidas has the second most top endorsement deals (~15-20%) followed by Under (~10-15%). 

In the past, the industry has offered good fundamentals and good stock returns.  Below is a table of the fundamental & price performances over the last 9 years for each of the industry’s key players:

Currently, within the industry, Under Armour appears to be the most likely candidate for mis-pricing.  The stock has dropped approximately 50% in the past year and is trading near its historical low EV/Sales ratio.  As part of the 3Q2016 earnings call, management warned investors that sales growth would slow over the next two years, and then, after 26 consecutive quarters of >20% sales growth, Under Armour’s streak ended in 4Q2016 with sales growing by 11%.  They followed up with 1Q2017 year-over-year sales growth of 6.6% (including North American sales dropping 1%, wholesale revenues increasing 3.8%, footwear sales up 2.0%, and Connected Fitness sales up 2.3%).  Meanwhile, SG&A expenses increased 11.7%.

So, the key questions are:  What has caused Under Armour’s recent struggles and are they temporary or permanent?  …

Read more
Andrew Kuhn June 17, 2017

Stock Write-Ups

Comment below a stock symbol that you would like Geoff to research and do a write-up on. He will choose from this comment section 2-3 times a week.

Read more
Andrew Kuhn June 17, 2017

Investing Questions

Comment below any sort of question(s) related to investing to get a direct answer from Geoff.

Read more
Andrew Kuhn June 17, 2017

Sessions with Geoff

[ecwd id=”2135″ type=”full” page_items=”5″ event_search=”yes” display=”full” displays=”full,list,week,day” filters=””]

As a member, you can book a session with Geoff over skype to ask him anything about investing one-on-one. Comment below on what slot you’d like and Geoff will reach out to you. First-come, first-serve.


 …

Read more
Skip to toolbar