As I’m writing this: the stock is back down to $32.85 a share, which is basically what I bought my shares at back in October. So, I wanted to point that out to members who thought the stock was more expensive than when I looked at it and so not worth a look. You can, if you want, get shares at basically the price I got mine.
The company’s first annual report as a stand alone business came out. And they also have transcripts of the two earnings calls.
A lot of members have been emailing me about NACCO instead of talking about the stock on the site. From now on, this discussion thread is the place to ask me questions about the stock, discuss it, etc.
Exxon Mobil (XOM) is one of the oil majors. Traditionally, being an oil major has meant being a fully vertically integrated company from oil exploration, drilling, refining, and chemical production. ExxonMobil continues to fulfill that role, but they are much more than an oil company today. Although they are typically billed as an oil AND gas company, they are much more.
Business Model Overview
ExxonMobil is a very complicated business with many different parts. The simple way to look at the business is that ExxonMobil operates as a vertically integrated company. They source and sell commodity products. Since ExxonMobil’s focus is in commodities, they have no general pricing power in the market.
Consequently, Exxon’s profits are quite cyclical, and hard to predict. However, the vertically integrated nature of the company dampens the cyclicality of the business cycle to a large degree. When oil prices are low, refining margins are usually high. Alternatively, the chemicals business could continue to make a profit while both oil sourcing and refining are less profitable.
This vertical integration and diversified structure is the key advantage of ExxonMobil and the other oil majors.
Durability
I believe that ExxonMobil is a company with infinite durability. The company traces its history back to the original days of Rockefeller and Standard Oil of New Jersey. Exxon has been in continuous operation for over 100 years. You should be able to expect them to continue to operate for at least another 100 years. At a minimum, well beyond your investment time horizon.
The reason for this is quite simple. Although ExxonMobil’s business is currently focused on the commodities oil and natural gas, that won’t always be true.
ExxonMobil is best analyzed as an “Energy” company. While the individual commodity product might change, the overall goal is the same. ExxonMobil is in the business of providing energy to their customers. Currently, this takes the form of oil and gas, but they certainly are not limited to that.
ExxonMobil was originally simply a diversified oil company. Then, as the market changed as natural gas become a larger portion of our energy sources, ExxonMobil acquired a major natural gas company, and has become one of the world’s largest natural gas producers.
The same will occur if the mix of energy ever shifts again in the future. Currently, the thought is that renewables, such as solar or wind power will disrupt the oil majors, such as ExxonMobil. This is not likely to happen. Instead, I would expect ExxonMobil to operate in the oil and gas business until they recognize that renewables are finally ready for the mainstream. Once they do, they’ll acquire a major renewable energy company, and quickly build it up. It won’t be long before ExxonMobil is then one of the largest renewable energy producers on the planet.
ExxonMobil has both the scale and the financial resources to accomplish this goal.
EM Systems (TSE: 4820) is an industry leader in pharmacy software looking to leverage its strengths in closely related industries.
The company’s biggest strength is its business model, which lowers industry standard system implementation costs and better aligns cost structure to its customers’ operating performance.
Share price is a little elevated today at 1,398 yen per share (13.8 TTM EV/EBIT). Investors can reasonably expect an investment CAGR between negative 2.5% and 8.8% over the next three years.
Introduction
EM Systems (TSE: 4820) primarily develops, sells and maintains software geared for pharmacies. With a 26% domestic market share, the company is an industry leader. More recently, EM Systems started focusing on Medical systems (Electronic Health Record) and Nursing Care systems. By the end of fiscal 2019 (March 2019), the company aims to achieve market shares of 40% in pharmacy software, 10% in Medical systems, and 5% in Nursing Care systems.
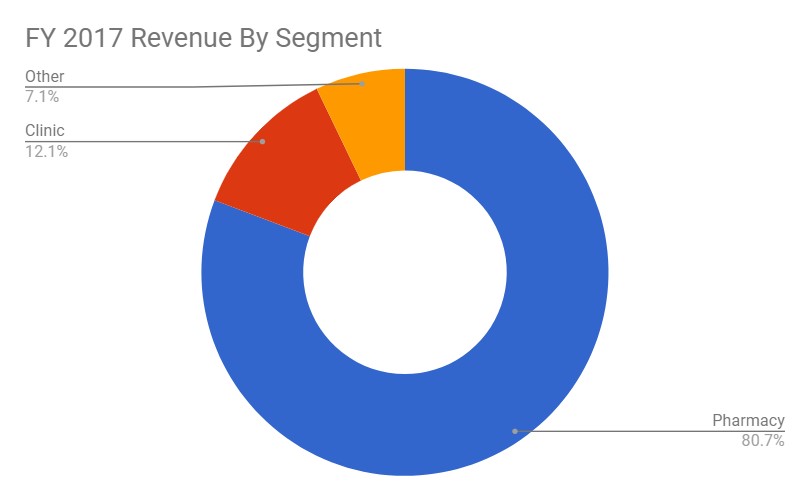
The company has three reporting segments: Pharmacy, Clinic (Medical system), and Other (includes Nursing Care system).
During the fiscal 2017 reporting period, 81% of revenues and virtually all of operating profit came from the Pharmacy segment.
Source: Author calculation based on EM Systems filings
Long-time Value Investor’s Club (VIC) members may be familiar with EM Systems. The company was covered on two occasions: Once in 2015 and again in 2017. I highly recommend reading both before proceeding, as I am hoping to fill in the gaps rather than repeat the same information.
Industry
Since the Pharmacy segment accounts for 81% of EM System revenues, this section will mostly focus on the pharmacy industry in Japan.
According to MAC Advisory (Japanese), the pharmacy market in Japan was a 7.9 trillion yen ($74.2 B USD) market in 2016. The top 10 pharmacy operators (by prescription revenues) accounted for 15.8% of the industry. 70% of pharmacies were operated by individuals. There are approximately 58,000 pharmacies in Japan.
In November 2017, I briefly covered the convenience store, drug store and pharmacy industries. The post can be found here. With a heavier focus on pharmacies, the highlights are below:
The three industries are merging/consolidating.
There is an industry-wide shortage of pharmacists, which is expected to continue.
Japanese government is pushing for “family pharmacist”, lower prices, and generic drugs.
Though it is tempting to look at Japan’s aging population and invest in pharmacies with a tailwind in mind, the Japanese government has a vested interest in reducing drug prices. With Japan’s universal health care system, all residents are required to participate in the public health insurance program. Participants shoulder a maximum out-of-pocket expense of 30% on government approved prescriptions.
The Japanese government reviews health care costs (including drug prices) every two years. Nursing care costs are reviewed every three years. Every six years, both reviews land on the same year, and 2018 is that year. Japan Times writer Tomoko Otake wrote about the highlights of this year’s health care review, effective April 1. In short, …
“Are you willing to share your reason for not investing at this time?
My first pass analysis leads me to also not choose to invest at this time. For me, it’s a matter of opportunity cost. Simply beating the S&P500 is insufficient. Since the S&P500 is projected to return much lower than its historic rates of return, my current opportunity set is much better.
That’s really always been my hesitation with owning something like timberland. I’ve been interested for diversification reasons, but in order to achieve double digit returns over long periods of time, you have to really buy at a large discount.
While I agree with the analysis that downside looks limited here, I struggle to come up with a scenario where a long-term owner (10+ years) could earn 10%+ returns. I understand though, that if the company is sold in a shorter amount of time for a premium, you could earn that hurdle rate over a shorter period of time. With that said, I think purchasing below $75-80 per share would offer the additional 2%/year return that I need for a 10 year holding period.
Sure. So, it’s easy to imagine a scenario where a long-term holder of timberland makes 10% plus returns. All you need is high inflation. Timberland’s long-term returns should be driven by: the cash flow produced by the annual harvest, the biological growth, the rate of inflation, and then also there tends to be some return – at least historically this has been true as countries develop – of competing uses for the land. This last factor is not important in Upper Michigan. But, there are places in the U.S. where it is. There’s nothing nominal about any of the factors driving returns in timberland. All the factors driving returns are real factors. So, if you had 6% inflation or higher – it’s likely timberland would return 10% or more a year for as long as that situation continued. You can check the historical record for periods of high inflation in the U.S. and see how timberland performed versus stocks, bonds, commodities, etc. during that period. The answer is good.
Over periods as short as 5-10 years, the factors driving timberlands returns would really just be the purchase price you were getting in at (if you’re buying a timber stock – this means both where we are in terms of timberland pricing and where the share price is versus the appraisal value of its timberland) and then whether demand for housing increases while you hold the timber stock. There are other uses for timber, but the most cyclical use for the more profitable trees is housing. So, when you see a low projected return for the S&P 500 versus a high projected return for timberland over the next 5 or 10 years, what the forecaster is really saying is: stocks are relatively more expensive than timberland right now, home construction …
We can look at this objectively or subjectively. If we look at it objectively – that is, we study the stock – then we’d classify Facebook as a widely-known stock and Keweenaw as a lesser-known stock. This is usually how we talk about the situation. We separate the mega caps from the micro caps. We separate the stocks with analyst coverage, liquidity, etc. from those without all that. But, there is another – much less comforting – way of looking at the difference between Facebook and Keweenaw. If we look at it subjectively – that is, we study the stock picker – then, we’d say you’ve ordered your own, personal informational environment in such a way that you constantly hear about Facebook and rarely hear about Keweenaw. You spend a lot of time reading facts and opinions about Facebook and frequently feeling the urge to judge Facebook as a business and as a stock. Meanwhile, you don’t spend a lot of time reading facts and opinions about Keweenaw nor do you frequently feel the urge to judge Keweenaw as a business and a stock. This probably sounds wrong to you. “I didn’t organize my life that way,” you say. I never decided to think about Facebook all the time and Keweenaw rarely if at all.
No. Society made that decision for you.
As a member of a wider stock picking society, you consume a lot of information passively. It is brought to you. In fact, many of the stock ideas we have are ideas that were brought to us. Because you’re a Focused Compounding member, even Keweenaw was brought to you. There is a difference between active research and passive research. It’s the difference between conception and concurrence. If you pick up the Keweenaw annual report – never having read my write-up on the company – you’d have to conceive of a way to value it. You’d have to frame the problem of understanding the business a certain way. And then you’d have to appraise the business for yourself. But, when an idea is brought to you – and especially when it is brought to you again and again throughout the day – there is no personal, solitary act of conception. There is only the social act of concurrence or dissent. You do not have to conceive of Facebook as a stock at all. You need only read whatever bull thesis is …
Those are the links you need for information. This is the place to discuss the stock. For those wanting to discuss the stock, I know Vetle Forsland and Jayden Preston are following this situation to varying degrees.…
Keweenaw Land Association (KEWL) is an illiquid, unlisted stock. It trades something like $15,000 to $20,000 worth of stock on an average day. The company does not file with the SEC. However, you can find plenty of information – including investor presentations, annual reports, quarterly reports, and other news – at the “company reports” section of Keweenaw’s website. You can also find news about the company – including press releases from a 26% shareholder who is trying to take control of the board – at Keweenaw’s OTCMarket.com “News” page.
Keweenaw Land Association owns timberland in Upper Michigan. It has 185,750 acres of timberland and 401,841 acres of mineral rights. The difference between those numbers – 216,091 acres of mineral rights – is “severed” mineral rights where Keweenaw sold timberland without selling the mineral rights on that land.
The company has 1.3 million shares outstanding. So, each shares of Keweenaw Land Association is essentially made up of 0.14 acres of timberland, 0.31 acres of mineral rights, some cash, some marketable securities, and some debt. Of those assets and liabilities – it’s the 0.14 acres of timberland that matters most. Unlike many of the big, publicly traded timber companies, Keweenaw Land Association is not a REIT. However, the current board has said they plan to convert to a REIT for tax year 2018.
First Let’s Deal with the Catalysts: 3 Weeks till a Contested Proxy Vote, REIT Conversion, Copper, etc.
I say “current board”, because Keweenaw is in the middle of a proxy battle that will decide board control at the April 12th vote. So, there is a catalyst here. Control of the board might flip 3 weeks from today. The party contesting the election is Cornwall Capital. Cornwall has 2 of 8 board seats right now. They are contesting 3 board seats at the April 12th election. If they win all 3 board seats, they will have a majority (5 of 8) board seats. Cornwall Capital is a long-term holder of the stock. I believe they have held Keweenaw shares for about 10 years. The firm is run by Jamie Mai (who already sits on Keweenaw’s board). Cornwall Capital owns 26% of Keweenaw’s shares outstanding. Jamie Mai was mentioned in Michael Lewis’s “The Big Short”. The Paul Sonkin that Cornwall is running on their ticket for the April 12th vote is the nano-cap/micro-cap investor who used to run Hummingbird Value, works at Gabelli, and co-wrote one of Bruce Greenwald’s value investing books. I don’t have much of an opinion on this board vote, the nominees, etc. I just thought it was worth mentioning that if you – as a value investor – are thinking the names Jamie Mai and Paul Sonkin sound familiar, it’s likely because you read “The Big Short” and “Value Investing: From Graham to Buffett and Beyond”.
Another potential catalyst is that Keweenaw could convert to a REIT. The board had previously said this was a bad idea. Now, they say they’ll do …
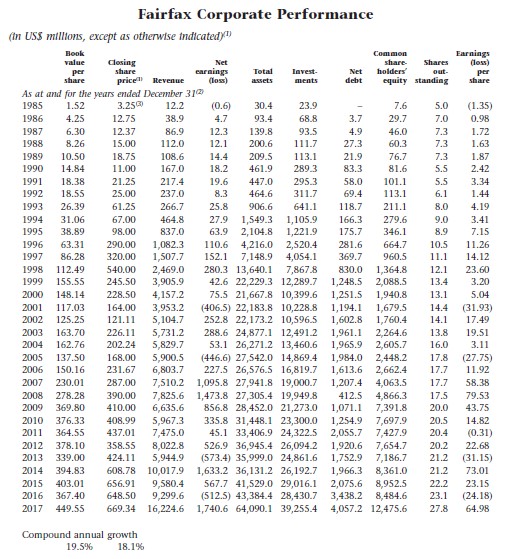
In the past 10 years Fairfax Financial has achieved what can easily be considered sub part returns, however I believe that the company will outperform the S&P significantly in the next 10 years as a result of the improved rate of return on their investment portfolio and a multiple expansion on their stock. One of the main reasons that their stock is undervalued today is because people are anticipating that Fairfax’s growth will underperform in the future as it has in the recent past. Fairfax’s entire history however tells a different story. From 1985 to 2017 Fairfax achieved a compound annual growth rate of 19.5% on their book value (Source: 2018 Annual Report). This is a tremendous achievement over the span of 3+ decades which many people seem to forget. Fairfax has (until recently) been heavily hedged against equities, at a time the S&P continued to grow to unprecedented levels year after year and this underperformance is still very fresh in people’s memories.
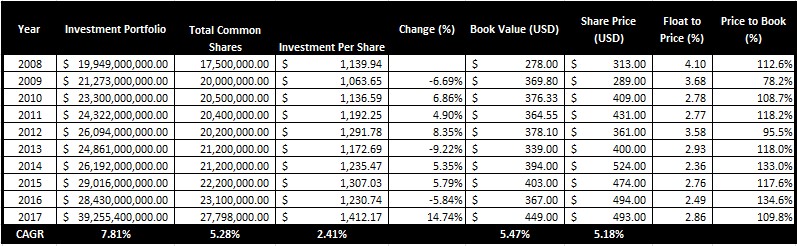
The hedging has always been justified by Fairfax management by reiterating their goal of protecting shareholders capital against (what they perceived) as a major risk of deflation in the global economy, which was not entirely unreasonable given how much money the Federal Reserve injected into the economy post 2008. Over the course of the past 10 years Fairfax has been quietly building their set of tools to take advantage of the next big opportunity that the market offers them. From 2008 to 2017 they have managed to compound their investments per share by 2.4% and compound their book value by 5.4% per year. At today’s price you are paying approximately 1.1x book for the business. In this article I will summarize why I believe Fairfax is a very good investment opportunity for investors today.
Investment Portfolio
Fairfax’s current investment portfolio is comprised of a combination of book value, debt and insurance liabilities (float) and is worth $39.2 billion as of Q4 2017 (Source: 2018 Annual Report). This amount currently works out to $1412 per common share ($1250 per common share less debt and goodwill) where about $819 per common share is made up of their insurance float (Source: 2018 Annual Report). When a value investor finds opportunities to put this amount of money to work at a decent return, the relative impact on shareholders’ equity can be dramatic. Recently Fairfax has removed a considerable amount of their equity hedges from their portfolio and is now sitting with about 50% of their investments in cash. As with many other value investors who are expecting the next big opportunity in stocks to come in the near future, this sort of “war chest” is exactly what they need in order to surpass their previous 10 years investment performance.
In this year’s shareholders letter Prem Watsa had indicated that buying back shares would be done more aggressively in the future than in the past. At today’s stock price of $495 or 1.1x book value and …
Target Upside: 150% (ability to compound 20%+ p.a.)
Price/Net Tangible Assets: 1.95x
Country: New Zealand
Price/Underlying TTM EPS: 18.0x
Industry: Senior Living
Price/IFRS TTM EPS: 6.8x
Summerset (SUM) is a retirement village developer and operator. It has created 20% CAGR in shareholder value since its IPO in 2011 and is just entering an accelerating growth period
Summerset’s operating model is that it operates its retirement villages and provides care to residents at very thin margins of 3-5%. In return residents are inherently selling Summerset a free call option on real estate/entry fee appreciation as well as providing Summerset with interest-free float
Summerset is currently trading at around 1.95X Price/net tangible assets, 6.8x NTM IFRS EPS and 18.0x NTM Underlying EPS while generating a 14.3% ROE, providing a wide margin of safety to its intrinsic value. Summerset will grow at a minimum of 18% p.a. to leverage demographic tailwinds. There is some downside protection through the highly conservative assumptions CBRE uses for appraising Summerset’s real estate
Key Thesis Points
Call Option on Real Estate/Entry Fee Appreciation
Float: The business model inherently generates a large amount of float, which finances the majority of development costs for new retirement villages and provides leverage to the above-mentioned call option
Demographic Tailwinds: New Zealand is now entering a demographic sweet spot for Summerset, brought about by accelerating aging trends
Understated Book Value: Accounting conventions, coupled with CBRE’s highly conservative valuation depress book value but also “bake in” rapid future book value appreciation
Industry
Summerset is a New Zealand based retirement village operators
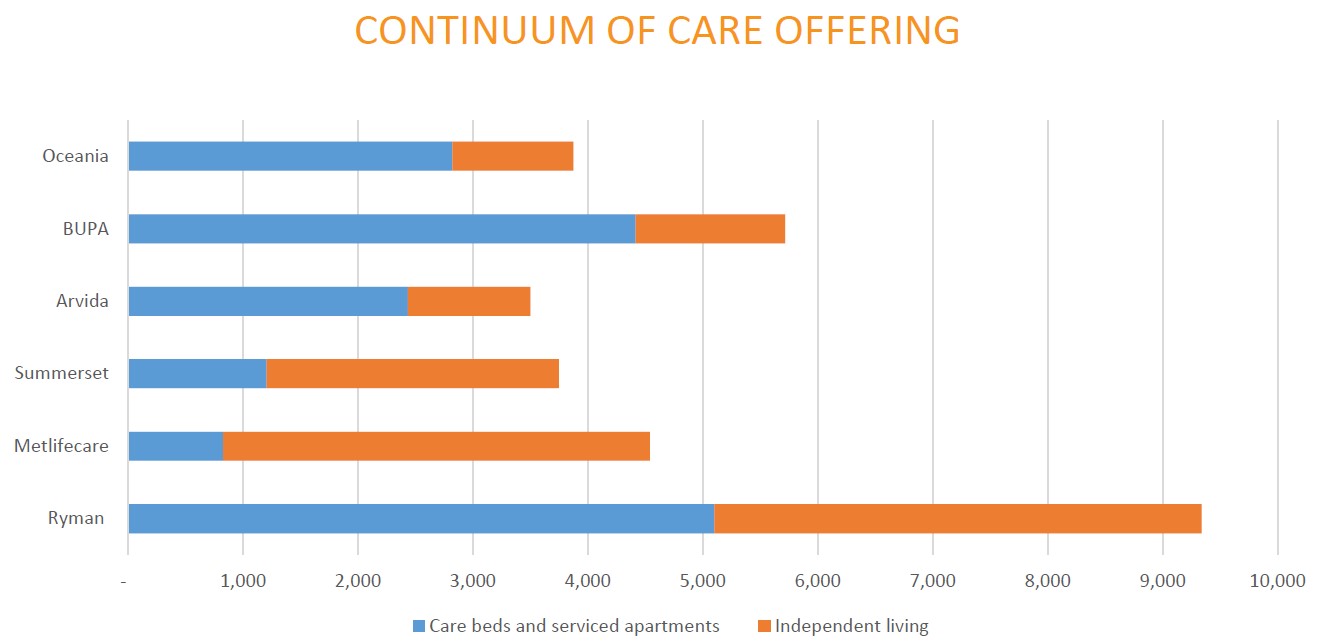
Source: Ryman Investor Presentation 2017
As shown above, there are five other large retirement village operators in New Zealand (Ryman, Metlifecare, Bupa, Oceania and Arvida). The top six operators have around 65% market share and are continuing to grow their market share at the expense of smaller operators at about 2% p.a. This report focuses on Summerset due to the combination of inexpensive valuation, quality and scale
Operators face a tradeoff between focusing on independent living and senior care. Summerset falls more heavily on the independent care end of the spectrum, a business that more closely resembles that of a hybrid real estate developer plus property manager
Ryman is the largest and highest quality operator with about 18.5% market share of the retirements units market in New Zealand whereas Summerset has a market share of 11%.
Summerset eventually plans to expand into Australia. Australia has a larger number of smaller competitors including publicly listed Japara Healthcare, Regis Healthcare, Ingenia Communities, Stockland and Aveo
Over time, the New Zealand retirement village industry has tended to consolidate. I believe the same will happen in Australia due to the advantage that large float and cheap access to capital markets confer upon larger players
Source: Metlifecare Presentation
Summerset sells three types of apartments: Villas, independent living units and serviced and memory care apartments. Villas require a higher
Amadeus is a large, Spanish-headquartered IT company serving customers in the travel industry, tied to the long-term growth of transactions in the global travel industry.
First, let’s talk a bit about what the company does. Although all of Amadeus’ activities relate to the travel industry, the company is in effect two completely separate businesses: the operation of a global distribution system (“GDS”) and the provision of software to companies in the travel industry – mainly airlines.
Amadeus was founded in the 1980s as a partnership between four European airlines: Air France, Iberia, Lufthansa and SAS. (At this stage, it was only the GDS side of the business – the software business came later.) A GDS is, essentially, an aggregation platform sitting between users of travel services – principally travel agents – and providers of travel services, such as airlines, hotels, train operators, and the like. So, it is a two-sided marketplace, aggregating both supply – the inventory of flights, hotel rooms and so on – and demand – travel agents and other travel intermediaries (for example, corporate self-booking platforms). The Amadeus GDS, like other GDSs, is a transaction-driven business model, principally earning fees when reservations are placed. Fees are also earned for services provided to travel agents.
Some years later, in the early 2000s, Amadeus launched what has become its IT business. This business is the provision of software to airlines to manage various aspects of their operations – from customer search and booking, through to ticketing, reservation, check-in, baggage, and weight management of the aircraft. Similar to the GDS, Amadeus operates a transaction driven business model, charging its airline customers fees on a per passenger boarded basis.
I mentioned that Amadeus was initially founded as a partnership between four European airlines. In 1999, the company was listed, only to be the subject of an LBO by Cinven and BC Partners (with three airlines – Air France, Iberia and Lufthansa – also taking stakes). The company was subsequently re-floated in 2010 following a successful period of private ownership and has remained public since then.
Given that Amadeus has two very distinct businesses, it makes sense to address these in turn.
First, though, I set out some financial information for the business from 2007 – 2017 which should give you some context as I discuss its principal operations. All figures (other than percentages) are in millions of Euros.