Garrett Motion (GTX): Messy Financials, A Peculiar Indemnification Liability, & Typical Spin-off Dynamics Have Obfuscated Garrett Motion’s Attractive Underlying Economics
WRITE-UP BY JONATHAN DANIELSON
Overview – Recent Events and Thesis
Garrett Motion (GTX) was spun off of Honeywell in September of last year as part of Honeywell’s ongoing series of divestitures (REZI, GTX, & ASIX). GTX primarily is in the business of designing and manufacturing turbochargers for automotive OEMs. They also design and make E-boosters for hybrid vehicles. As part of the spin-off agreement, Honeywell dumped their Asbestos Indemnification Liabilities on the newly formed entity (approximately $1.4 billion in total liabilities) in addition to loading the newly formed company up with debt that was 3x EBITDA. These dynamics have most likely led the market to view Garrett as a “garbage barge” spin, designed to solely benefit the parent by improving its capital structure and allowing the parent to quietly remove toxic assets off their balance sheet.
Investors in the special situation arena must pay close attention to this possibility, as buying into a garbage barge spin can have devastating results on your portfolio. Nevertheless, assets that the market apparently view as being “garbage”, a closer examination reveals a company that’s an entrenched market leader, possesses a formidably wide moat, earns adequate returns on capital employed, has reasonable growth prospects over the coming years, and is trading at a ludicrous 25% Free Cash Flow yield.
In addition, the Company is inherently highly cash flow generative, with a proven management team in place, and a business model that lends to a good degree of top-line visibility as car/engine designs are started years in advance.
The Company – A Brief History
Founded in the 1930s by Clifford Garrett, GTX was originally an aviation company, supplying the industry with turboprop engines and turbochargers. It wasn’t until the post-war 50s that the Company first started supplying the auto industry with turbos. In 1954 Caterpillar selected Garrett’s T15 turbo for its D9 mining vehicle. Then in the 60s came the Oldsmobile Jetfire Turbo Rocket and the T04 turbo for Deere’s farm tractor. Garrett was gobbled up by Honeywell in the late 1990s and went on to play a significant role in the company’s Transportation Systems segment.
Now, if some of you reading this didn’t grow up with a ‘grease-monkey’ older brother, then you’ll be forgiven for being a bit fuzzy on the specifics the role turbochargers play in enhancing the performance of internal combustion engines. Essentially, in order to increase the power of an engine, you have to pump more air into it (not just more gas). There are really only two ways to do this: by increasing displacement of the engine (which has obvious limitations) or by making the engine more efficient. Here’s a fun video to give you an overview: Turbocharger Basics.
It’s important to note the differences between turbochargers and superchargers as they are very much competing products. The differences between the two products has led to a secular tailwind for the turbocharger market. The way turbochargers increase an engine’s efficiency is by using the engine’s unburned fuel (the exhaust) to power the turbine, which then uses a compressor to funnel more air through to the engine’s cylinder. Which, in turn, also lowers the engine’s emissions. This article on the subject by Explainthatstuff sums up the key differences between turbos and superchargers nicely: “Where a turbocharger is powered by wasted energy in the exhaust” (increasing the MPG) “a supercharger actually steals energy from the car’s own power source (the crankshaft), which is generally unhelpful”.
To demonstrate the difference a turbo makes compared to a naturally aspirated engine, as detailed in the Company’s investor day, you can take a 4 cylinder 2.3L engine and add a turbocharger to it and get the the same output as a V6 3.0L engine. These characteristics of turbos have to led to mass adoption of the product by OEMs over the previous 5 years and will continue to do so moving forward, which will be discussed later.
Business Model
As noted above, Garrett Motion derives revenue from designing, engineering, and manufacturing turbochargers and electric-boosting technology and selling them to automotive OEMs. Additionally, they distribute their products to Aftermarket consumers via 190 third-party distributors. Over 100 million vehicles are on the road today with Garrett turbos.
GTX is a global enterprise which has operations in North America (15%), Europe (56%), and Asia (29%). They also sell E-boosters for hybrid cars and hydrogen fuel cell powertrains. Their customers consist of the major OEM players, including: Ford, Volkswagen, Hyundai, Mercedes Benz, etc. in addition to off-highway manufacturers like Deere and Caterpillar. They have 13 manufacturing plants, 13 engineering sites, and 5 R&D sites.
The nature of this business ultimately leads to a handful of market leaders who have the infrastructure, experience, and relationships to compete – and the rest who don’t. Garrett is the market leader with about 30% of market share followed by BorgWarner and IHI, neither of which are exactly comparable to GTX since Garrett is a pure-play. These industry dynamics lead to Garrett having compelling underlying economics.
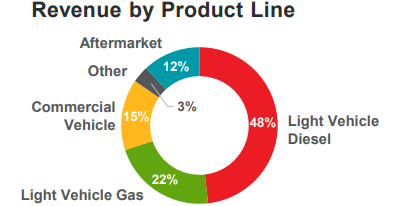
There’s a few ways to slice up the company when analyzing the business. Firstly, Garrett has two main endmarkets: selling to auto OEMs (86% of rev) and distributing its products via the Aftermarket (12% of rev). To further break the Company’s operations up, we can look at the various types of automobiles they service within their OEM segment. These include: Light Vehicles (sedans, SUVs, Pickup Trucks) and Commercial Vehicles (construction, agriculture, off-highway trucks, ect.). Light Vehicles accounted for 66% of revenue while Commercial Vehicles contributed the remaining 20%. We can further still break down Light Vehicle revenue by Gas (22%) and Diesel (48%), as the Chart below demonstrates.
 It’s important to note that the Company has transitioned from mainly selling Diesel products to Diesel and Gas. While GTX is expecting most future growth in top-line to come from the Gas segment, it’s unreasonable to assume that the Diesel segment is going away anytime soon. The sector of the Diesel market that has been hit the hardest has been smaller engine cars. Larger cars (SUVs, Pick-Ups, etc.) and Sedans have been relatively stable – and these two segments make up 94% of Garrett’s Diesel sales. There’s a lot of benefits that Diesel engines offer to larger cars. They improve fuel economy by up to 20%, have 10%-15% less CO2 emissions than their Gasoline counterparts, and offer drivers more torque and towing capacity. Diesel might be slowing down, but I believe the notion that it’s dying is misconstrued.
Contracts to make an engine’s turbocharger are won years in advance. Naturally, this creates the ability for the Company to have revenue visibility because they already know what contracts they have been awarded or are likely to win. Despite this, Garrett isn’t immune from a broad downturn in the auto market as the OEMs don’t specify the amount of turbos they’ll buy. Nonetheless, this business model still provides Garrett with the ability to gage what the next few years will look like. And from 2015-2017 the company had a win rate for Gasoline of 45%, Diesel of 55%, and Commercial of 50%.
The Company is extremely asset-light as it outsources all of raw material processing to suppliers and buys the finished goods instead of making it themselves. This is what pushes working capital into the negative. Additionally, the Company has very little operating leverage. GTX discloses that approximately 80% of costs are variable in nature – providing margin protection in a downturn.
Quality and Product Economics
If an auto OEM is going to include a turbocharger in the design of the new engine, the turbos have to be specifically engineered for the new engine. This is an extensive process that leads to GTX working closely with the auto manufacturers. The process is strenuous as it involves 4 years of pre-development, 2 years of product development to get the product customized for the customer, 3-5 years of vehicle development, and then approximately 10-15 years of aftermarket replacements. This is not simply a commoditized product.
The Company’s close ties to auto OEMs, in addition to being geographically close to their customers, is a key source of Garrett’s competitive advantage. Being the market leader in this industry leads to significant scale in addition to high switching costs. Having these relationships keeps new entrants at bay as well. All of these factors play a role in creating a moat for the company and lead to compelling product economics.
We’ll assess GTX’s underlying economics a couple of ways. The first, and most obvious way, is to break out how many units (turbos) the company produces annually and determine the profitability of each and every unit sold. It should be noted this isn’t an exact science, since the Company works closely with every car manufacturer prices will fluctuate on a case by case basis. Rather, this exercise should serve as a rough approximation to gain a more intuitive feel for the intricacies of the company in question.
As reported in the Company’s form 10, the Turbocharger market is roughly $12 billion annually. On a per unit basis this comes out to 51 million units being produced every year. Garrett occupies between 25%-30% of the total market. So in a $12 billion market, they command roughly $3.5 billion. On a per unit basis, we can estimate this translates to GTX producing approximately 12.75 million units annually.
Revenue derived from auto OEMs for FY 2017 was ~ $2.7 billion. Assuming a gross margin of 22% and an operating margin of 13%, for every turbocharger sold OEMs Garrett grossed $51 and captured an operating profit of $30. We can gage this as being roughly right because if we extrapolate these figures for what we previously had calculated Garrett’s per unit market share, Operating Income equals ~$380 million, which essentially what the company reported in 2017.
| Revenue per unit | $235 |
| GP (22%) | $51 |
| OI (13%) | $30 |
Moving forward, there is the potential for margin expansion as their E-Turbos for hybrids and hydrogen fuel-cell cars are 50%-100% more per vehicle. The E-booster segment currently only contributes 2% of total revenue as GTX is just getting started with hybrid cars. This gives the company an additional attractive market to grow in with even better economics than the current gas and diesel markets they already dominate. The Company reports that the industry is anticipating hybrid production to increase to 24 million by 2025 compared to only 1 million today. Garrett is well positioned to participate in this exponential growth as 76% of hybrids are forecasted to be turbocharged by 2025.
A second way to think about Garrett’s underlying economics is by determining how profitable each individual manufacturing location is. I think this approach is particularly valid for this company because each region is supported by its own engineering site and factory and can thus maintain sales and production capabilities on their own, without being reliant on corporate.
Garrett has 13 “close-to-customer” engineering and 13 manufacturing locations, which is a key reason as to why each region can be independent and maintain self-sufficient sales and production capabilities. As R&D expenses are rolled into COGS, I’ll only use the 13 manufacturing factories in determining Garrett’s underlying economics here. The economics of each factory are as follows:
| Revenue per site | $210,000,000 |
| GP (22%) | $46,200,000 |
| OI (13%) | $27,300,000 |
So each manufacturing site should be generating about $27 million per year. On a company-wide basis this comes out to $355 million in operating income. The company leases most of their factories and has very little by the way of heavy machinery. This is due to invested capital being driven in the negative as a result of the negative working capital business model. Because of these aspects of the business, I’ll opt for using a different metric than the traditional denominators such as NFA or Equity. Instead, I’ll use Assets and capital employed (as measured by Total Assets less Current Liabilities).
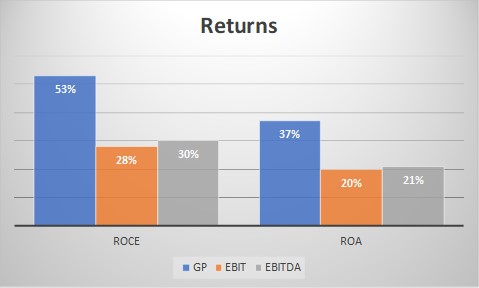 Quite clearly, Garrett is an above average business by any metric. Additionally, this isn’t a case of earnings being consumed by capex – the business spits out an impressive amount of free cash flow. In 2018, with gross profit of $776 million, GTX converted $278 million of that into free cash which represents a gross profit to free cash flow conversion of 35%.
Safety of Customers
When I first read about Garrett, the descriptions that popped in my head were things like “capital-intensive”, “top-of-cycle”, & “extreme cyclicality”. Once I dug into the business a bit more and realized this company produced exceptional returns and is by all measures a cash cow, my major concern became how they performed in the last crisis. This is especially due to the fact that a lot of the auto manufacturers were blowing up in ‘08-’09. Luckily for us, Honeywell breaks out their segments quite nicely. Garrett fell in the Transportation segment of Honeywell’s report. Here’s how they performed:
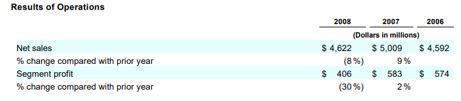 The specific entity that Garrett is now, with all its subsidiaries, isn’t that entire segment. However, Honeywell did go on to break out “Turbo Technologies” in the report, saying
“Turbo Technologies sales decreased by 9 percent primarily due to decreased volume from a broad decline in vehicle production due to challenging automotive industry conditions in the U.S. and Europe, which accelerated in the second half of 2008, impacting sales to both our commercial and light vehicle engine manufacturers”.
So, in the worst crisis in decades, with the automotive sector teetering on the edge of collapse (some did collapse), Garrett’s sales dropped by 9% and operating income probably dropped somewhere in the 30% range. Management touched on this in the Investor Day as they disclosed that 80% of their cost structure is variable. This gives them the flexibility needed to scale down dramatically during a downturn and still be profitable. This is a huge advantage GTX has especially when compared to the typical auto OEM or supplier. This reduces risk in the business as operating leverage cuts both ways and is notorious for blowing up companies.
Even though the Company performed well in the last crisis, the financial profile of their customers in 2019 is what’s more important to us. Even though we might be at the top of the cycle, I think it’s important to note the differences in the car maker’s financial profile from where they stood in 2008.
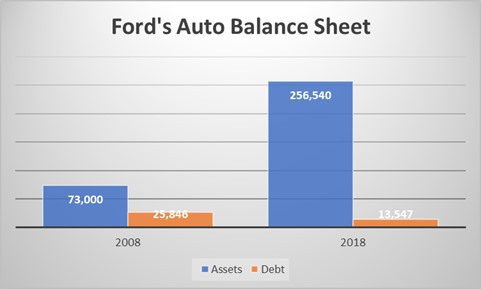
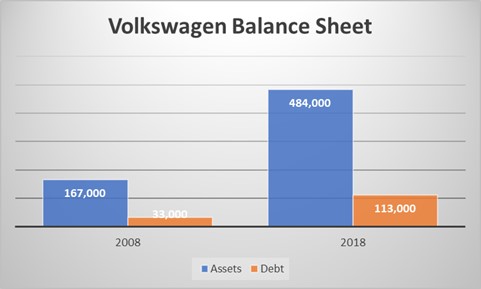
Now, if I were a shareholder of these companies, I wouldn’t be happy with these capital structures as they’re probably too conservative. But being a shareholder of a company who has these businesses as customers, these balance sheets make it much easier to sleep at night.
Dealing With Growth
“We’re going to see a lot more turbo engines,” – Chris Meagher, GM’s chief engineer for its Ecotec engines
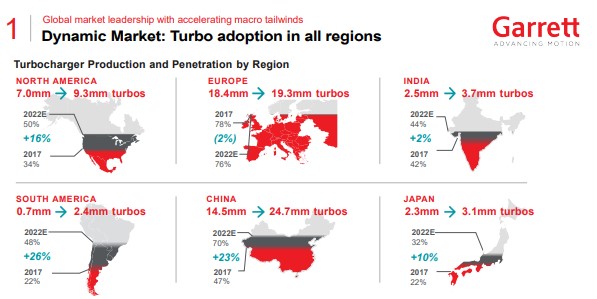 There are two main tailwinds for Garrett in particular. First, the wrong way to think about growth with this company is simply to assume it’ll be the same as auto production rates. Of course the growth in engines being produced is important, but what’s more important is the percentage of those engines that have turbos. From 2013-2018 the adoption of turbochargers by OEMs for their gasoline engine increased from 14% of the total market to 36%. Industry reports are forecasting that penetration will increase to 51% by 2022. This is due in large part from CO2 and emission regulations that OEMs have to meet. The only way to do that without compromising performance is by a turbocharger. Industry peers, independent analysts and research firms all support this thesis – we should continue to see adoption rates for turbos increase in the coming years. The chart above details Garrett’s forecasts region by region. And the fact that contracts are signed, and projects are started years in advance lends credibility to these forecasts.
Secondly, hybridization is something Garrett has been preparing for and investing in for years. I’m a big fan of Scott Miller over at Greenhaven Road Capital. A tendency of his that I’ve recently seen a couple of times now is that he likes to find “free call options” in the companies he buys (Yelp and Box come to mind). What this means is that the company in question typically has already invested in and come to market with a new product line. This is usually one that which has the potential for enormous growth – but also the market hasn’t priced into the company, and one that the investment thesis isn’t dependent on. It would just turn a good investment into a homerun.
I think similar dynamics are at play here with Garrett. The company already has a very profitable business and is well-established in the gas and diesel turbocharger market. Furthermore, the company has a portfolio of electric-boosting technologies that are coming to market for hybrid vehicles. Independent sources expect this market to grow 44% per year through 2022. This segment currently only represents 2% of revenue for Garrett. Thirdly, GTX has already developed software focused on automotive cybersecurity and integrated vehicle health management (“IVHM”). It’s hard to gage potential growth in this segment, but Garrett has already invested capital and time into these products over the preceding years – if they’re successful, investors only get the upside. Neither of these segments will play a role in the valuation of the company, but shareholders should pay attention to their development in the coming years.
The Asbestos Liability
As this liability has most likely played a significant role in making many investors drop their due diligence in the preliminary phase, understanding all the aspects of it are important. Firstly, the liability remains with Honeywell, Garrett is just responsible for paying 90% of the liability per year. Second, payments are capped at $175 million per year. This, by definition, means the situation can only improve for Garrett. If obligations come in at less than the cap, then that turns directly into free cash flow. New claims have been falling substantially since 2013, from roughly 4,500 new claims every year to a little over 2,600 new claims in 2017. Outstanding claims have dropped form >20,000 to ~2,000 over the same period. The Indemnification is a 30 year contract but is cancelable if the obligation comes in at less than $25 million for three straight years. Lastly, the Asbestos Liability is subordinate to the debt. Meaning, if paying the asbestos liability would send GTX into default, then they won’t have to pay it. This meaningfully reduces their leverage profile. Instead of being levered in the 4-5x EBITDA range, net debt/EBITDA turns out to be 2.2x.
Valuation
The best way to value Garrett is as a low-growth company and on a free cash flow basis. For low/no growth businesses, the multiple of FCF you would normally pay is 10-12x. Garrett’s closest peer, BorgWarner (BWA) trades at a little over 14x FCF. Even though GTX is less capital-intensive and has higher margins, perhaps the market would view GTX as riskier since it’s a pure play. A conservative appraisal of fair value for GTX is given below:
- $268 million in FCF
- *10 = 2,680
- 74 million shares out.
- $37/share
For an upside of ~131%. This appraisal does not factor in that only ~13% of capex is maintenance, any growth that is likely to materialize in top-line or magins, assumes the Asbestos Liability maximum is reached (FCF in 2018 was $10 million higher), and assumes the market would value this company on a discount with respects to peers.
If that’s not conservative enough for you, let’s factor in the entire capital structure using EV/EBITDA:
- $618 adj. EBITDA
- (less) $175 Asbestos Liability
- *8 = $3,544
- (less) $1,432 net debt
- 74 million shares out.
- $28/share
Which brings us to an 75% upside. BorgWarner has averaged an Enterprise Multiple of 8 over the past 5 years. Once again, the figures above are overly conservative by my estimation. Let’s say the Company is able to grow top-line by 3% per year for the next three years. If the market values the Company in line with peers at a 6%-7% FCF yield, the stock would be worth ~$60, or a CAGR of 55% for 3 years.
Possible rationales for the opportunity
There are many, many reasons as to why Garrett is so grossly mispriced. In many ways, GTX is the archetypal spin off:
- It’s miniscule compared to the huge conglomerate that spun them off
- This quite likely resulted in retail investors selling without a second glance
- Index funds had to puke the stock up
- GTX operates in an industry with a palpable “ick” factor amongst investors (everyone hates autos, thinks we’re at the top of the cycle, ect.)
- Abhorrent financials when superficially studied (asbestos liability, negative book, negative 2017 earnings)
It’s everything Joel Greenblatt told us to look for and more. Add in a management that is extremely experienced (all with ~20 years or more in the industry, all but the CFO are coming over from Honeywell), and is well-incentivized with long-term equity awards in addition to insiders owning 2% of the company, and we have all the makings for a classic spin-off.
Risks/Factors I’ll be keeping an eye on are:
- Customer concentration. Although it is common practice in this business, the top two customers accounting for ~25% of revenue does add some inherent risk.
- Slow down in Diesel sales
- Slow down in broader economy/Currency risks
- Capital Allocation. The company is by all measures, a cash cow. Once they pay down debt how the Board decides to allocate capital will be of utmost importance.
To conclude, a company with secular tailwinds behind it, that’s generating healthy amounts of cash, and is an engrossed market leader simply cannot trade at these levels for a sustained period. In the short-to-medium term if a recession were to emerge then the stock won’t perform well over that period – like every other stock. But over the long term, this company is just too good to be this cheap.
Further reading
https://medium.com/self-driving-cars/the-automotive-supply-chain-explained-d4e74250106f
https://www.popularmechanics.com/cars/how-to/a12765/4306310/
https://investors.garrettmotion.com/Cache/396947023.pdf
https://investors.garrettmotion.com/Cache/1001243197.PDF?O=PDF&T=&Y=&D=&FID=1001243197&iid=10875661
https://www.explainthatstuff.com/how-turbochargers-work.html