Truxton (TRUX): A One-Branch Nashville Private Bank and Wealth Manager Growing 10% a Year and Trading at a P/E of 14
by GEOFF GANNON
Truxton (TRUX) is an illiquid, micro-cap bank stock. TRUX is not listed on any stock exchange. It trades “over-the-counter”. And it does not file with the SEC.
The bank has two locations (one in Nashville, Tennessee and one in Athens, Georgia). However, only one location (the Nashville HQ) is actually a bank branch. So, I’m going to be calling Truxton a “one branch” bank despite it having two wealth management locations.
The company doesn’t file with the SEC. But, it is not a true “dark” stock. It has a perfectly nice website with an “investor information” section that includes quarterly earnings releases.
Still, if Truxton doesn’t file with the SEC – how can I find enough information to write an article about it?
Truxton – as a U.S. bank – does file reports with the FDIC even though it doesn’t file with the SEC. So, some of the information in this article will be taken from the company’s own – very brief – releases to shareholders (which are not filed with the SEC) while other information is taken from the company’s reports to the FDIC. Truxton also puts out a quarterly newsletter that sometimes provides information I might talk about here. Those 3 sources taken together add up to the portrait of the company I’ll be painting here. Some other info is taken from Glassdoor, local press reports, etc. But, that’s mostly just color.
So, it is possible to research Truxton despite it being a stock that doesn’t file with the SEC.
But, is it possible to actually buy enough Truxton shares to make a difference to your portfolio?
It depends. Are you an individual investor or a fund manager? Do you have a big portfolio or a small portfolio? And – most importantly – are you willing to take a long time to build up a position in a stock and then hold that stock pretty much forever?
No shareholder of any size would have an easy time getting out of Truxton stock quickly. But, if you intended to stick with the company for the long haul – it is possible, if you take your time buying up the position, for individual investors to get enough TRUX shares.
The math works like this…
Truxton shares are illiquid but not un-investable. In an average month, there might be around $300,000 worth of shares trading hands. Let’s round that down to $250,000 to be conservative. Let’s say you can buy 20% of the total volume of shares traded in a stock without much disturbing the price. That’s one-fifth of $250,000 equals $50,000. So, let’s say you can put $50,000 a month into Truxton stock without anyone noticing. That’s $150,000 per quarter, $300,000 every six months, and $600,000 over a year. Most investors don’t put much more than 10% of their portfolio in a single stock. So, if you’re willing to take up to a year to buy it – Truxton is investable for anyone with an account of $6 million or less ($600,000/10% = $6 million).
Now that we know it’s possible for an individual investor to buy enough shares of this bank – if he intends to hold the stock for the long-term – the obvious question is whether this is a good stock to hold for the long-term?
It is.
Truxton is an exceptionally small and fast growing bank with very high returns on assets and equity. These things often go hand-in-hand in banking. The very smallest banks enjoy the fastest improving economies of scale as they get bigger. This means that a dollar of extra deposits taken in at a one branch bank will tend to increase EPS faster in percentage terms than it increases deposits in a way that is much less likely to be true at a bank with a thousand branches. We can see this clearly at Truxton. The bank’s return on equity has more than tripled in the last decade. It won’t triple again in the next decade – or likely ever. The reason ROE could grow so quickly in the last 10 years is because it started from such a low level. A new one branch bank is very inefficient compared to an older, multi-branch bank. And then we have the relationship between quick growth in loans, assets under management, book value, etc. and high returns on assets and equity.
A bank’s return on assets drives its return on equity with the only other factor being leverage. If two banks use the same amount of leverage, the bank with the higher ROA will have the higher ROE. And then a bank’s ROE is a necessary – though not sufficient – driver of that bank’s growth in deposits, earning assets (like loans and bonds), etc. A bank’s growth is limited by its return on equity and the demand for deposits and loans. For a bank to make a loan, it generally needs to have deposits to lend (though some banks may borrow to make loans – this is only a temporary solution). How quickly can a bank grow its deposits? That depends on two things. One, how many new clients it can bring in to deposit money with the bank. That’s demand for deposits. But, then there’s also the bank’s ability to take the extra deposits. A bank can’t – for example – double its deposits if it has an ROE of 1%. Deposits – while an economic asset if they are low cost enough – are an accounting liability. So, if a bank increases deposits any faster than it increases equity – the bank will have increased its leverage ratio. Assuming a bank wants to keep its leverage ratio stable – and in the very long-run this is always a safe assumption – the bank shouldn’t increase its deposits faster than it increases its equity. Bank’s can increase equity by issuing preferred stock, issuing common stock, or retaining earnings. There can be some benefit to common shareholders from a bank issuing preferred stock. But, it’s similar to the benefit common shareholders get from any company issuing debt. If the debt is low cost – it can benefit shareholders. But, there’s a limit to how much leverage you can take on. So, it’s always best to assume that any company you are investing in will attempt to keep its leverage stable while you own it. In other words, don’t assume a bank you invest in well fund future deposit growth through preferred stock issuance. That would be like assuming that the supermarket chain you are investing in will fund all future store sites by issuing bonds. It might do that. But, it’s not good for a long-term investor seeking a safe investment to assume that’s where the company will get its funds from. Issuing new common stock hurts existing common stockholders. It dilutes your ownership of the company. There are cases where a stock can be so overpriced that issuing more shares benefits the existing shareholders because the price at which the new shares are sold is so high. However, the only shareholders who really benefit from this are “stuck” shareholders – usually insiders and major holders – who can’t easily sell most their shares in the open market. The truth is that for you – an outside, passive minority shareholder – if it ever makes sense for a company you own stock in to issue more common stock, it makes even more sense for you to just sell your own stock in the company yourself. So, it’s not a good idea to count on either preferred stock issuance or common stock issuance as the source of funding deposit growth. That leaves only one source of funding: retained earnings. A bank’s retained earnings will grow in relation to its equity through the return on equity ratio. If a bank has $40 of book value and earns a 10% return on equity it has $4 of earnings available to retain. Almost all banks will choose to pay some of these earnings out in dividends. Some banks may also choose to use some of these earnings to buy back stock. Whatever is left after the company pays dividends and buys back stock is added to equity. This is the company’s addition to both retained earnings and book value.
Over time, a bank can sustainably grow its deposits (and thus loans and bonds) at the same rate it grows its tangible book value. Basically, the company’s earning power (which comes from the interest received on loans and bonds) can grow as fast the company’s retained earnings. This is how the return on equity at a bank drives growth at that bank. Return on equity is the maximum sustainable growth rate at the bank. Most banks – in fact, almost all U.S. banks – will grow quite a bit slower than their ROE, because they will pay dividends or buy back stock. You can find examples of banks with a 20% ROE and only a 3% growth rate in deposits, loans, etc. This means the bank is using almost every penny it earns to pay dividends and buy back stock. For an example of such a bank see Bank of Hawaii (BOH). For a long time, that bank has earned far more on its equity than there is enough demand in the Hawaiian economy to soak up. The bank has enough fuel to grow 10% or 20% a year. But, the Hawaiian economy is growing only about a tenth as fast as that. And a bank that already has a big market share in Hawaii can’t really grow much faster than the Hawaiian economy as a whole. So, BOH has the fuel. But, it doesn’t have enough demand for growth to use up that fuel. So, it must pay that fuel out to shareholders. If BOH didn’t do this, it’d become less and less leveraged every year.
Truxton has both a lot of fuel (a high ROE caused by a very high ROA) and a lot of demand in its local Nashville market. Nashville is a fast growing city. And the richer population in Nashville – which is what Truxton, as a private bank and wealth management company is focused on – is an even faster growing part of that city.
So, we know how Truxton has been growing. It started with a low ROE. But, as the economies of scale of a one branch bank with a rapidly growing client base kicked in, that ROE rose and rose and rose. This high ROE translated into a lot of fuel – a lot of retained earnings growth – that allowed the bank to maintain the same leverage ratio each year even while taking in a lot more deposits and making a lot more loans. And then the local high-end Nashville market provided a lot of demand – unlike the Hawaiian market for BOH – where TRUX could burn its retained earnings fuel. In other words, Truxton is a growth story. Or, at least, it had been a growth story over the last 10 years.
Let’s put some exact figures on this growth. Just how fast did Truxton grow in its early years?
Truxton was founded in the early 2000s. But, it has only been public for a little over 9 years. During those 9 years, the company compounded its earnings per share at 29% a year. While EPS would seem to be the best kind of growth for shareholders to worry about – there’s an issue here. Ten years ago, companies paid higher taxes than they do today. So, the one-time federal corporate tax rate cut from 35% to 21% would skew compound growth figures higher. Even over as long as a 9 year period, that one-time tax cut could add between 2% and 3% a year to your EPS growth calculation. What I mean here is that if you take the period from 2009-2018 using 2009 EPS as your start point and 2018 as your end point and do a CAGR calculation, your annual compound growth rate will be higher by over 2% a year over those 9 years simply because your end point (2018) has a lower corporate tax rate (21%) than your 2009 start point (35%). These growth figures would be distorted even higher on an annual basis if we were to use short-term – that is, more recent – EPS growth numbers like asking how quickly did Truxton compound EPS over the last 5 years.
In other words: all of Truxton’s EPS growth rates – whether we are talking 15 years, 10 years, 5 years, or 3 years – are exaggerated higher by the tax cut. The exaggeration is quite small over say a 15-year period, quite huge over a 3-year period, but present in all periods.
To avoid this problem, we can simply calculate the growth in Truxton’s earnings power using pre-tax numbers. The only outside force that has changed is the company’s tax rate. So, we can create a sort of alternative history where the tax rate is either still 35% today or one where the tax rate was always 21% – even going back to the day Truxton was founded. The easiest way to do this is just to pick pre-tax metrics that we know end up driving post-tax earnings at a bank. The two big ones are assets under management and loans. In the long-run, assets under management and loans are two very good gauges of pre-tax earning power at a combined private bank / wealth manager. One is assets under management at the wealth management business. The other is total loans at the private bank. Because Truxton has gained scale going from a tiny bank to a somewhat less tiny bank – growth in loans and assets under management would understate the growth in true earning power. So, it’s a somewhat conservative measure. However, as a bank grows – the benefits of economies of scale tend to decrease. Size is still helpful going from a $1 billion in assets bank to $10 billion or even $10 billion to $100 billion – but, it’s less useful than the initial jump from a bank with $100 million in assets to $1 billion in assets. So, don’t expect Truxton’s returns on assets and equity to increase the way they have in the past. But, do expect that Truxton’s EPS will not grow any slower than its assets under management and its loans.
I should pause here to discuss why I am simply using “loans” at Truxton instead of “earning assets” or deposits. Generally, a bank will use all of its deposits to fund earning assets. Earning assets are a combination of loans and bonds. Some banks may make very few loans and buy a lot of bonds. Other banks may make a lot of loans and own very few bonds. Truxton is an example of the second kind of bank. It makes a lot of loans. It doesn’t own a lot of bonds. However, Truxton is a much more extreme example of this second kind of bank than most. Many banks own loans that are fairly standardized or even “conforming” in the sense that they meet the underwriting standards of a government sponsored entity (like Freddie and Fannie in home mortgages or Farmer Mac in farm and ranch mortgages). What you’ll find if you dig into Truxton’s loan book is that it’s not standardized in any way. These are customized loans. And this is notable in some very unusual kinds of loans appearing on Truxton’s balance sheet you almost never see on other bank balance sheets. The most obvious example of this is a “closed-end” mortgage. Many banks make “open-end” mortgages to clients of the bank and then quickly – pretty much instantly – sell those loans to someone else. They are not in the business of holding a 15-year mortgage for 15 years. These loans can often be refinanced as the appraisal value of the home increases or interest rates decrease without penalties to the borrower. Basically, the features of these standard mortgage loans strongly favor the borrower over the lender. However, the interest rates – to compensate for the advantages in optionality the borrower is getting – may not be as low as they could be. On top of this, the loans have to be fairly small. It wouldn’t be possible, for example, to borrow $4 million against a house appraised at $5 million in any sort of conforming way. Truxton, however, makes loans like that. And they may make those loans at lower interest rates than you’d expect. They also keep the loan on their own books instead of selling it. So, Truxton would make a 15-year closed-end mortgage loan on a very expensive house or a similar loan on non-owner-occupied real estate like an office building. These are more customized loans though than what you would see at most banks. And the terms of the loan – other than the interest rate – are more favorable to the bank. Using the closed-end mortgage example, you may have a home equity loan where you can borrow more money as the value of your house increases or as the balance of the loan is paid down. Likewise, you may have a fixed-rate mortgage lasting 15 or 30 years that you can pay early without penalty. The unusual loans that Truxton makes don’t work like that. Instead, the borrower would get $4 million today and could never again take more money out against the home using that same loan. They also could not pre-pay the loan without penalty. It is, in reality, a much more fixed loan in terms of the what the actual length of the loan will turn out to be, what the interest rate will be, and also what the safety of the loan will be over its entire life. Because Truxton makes so many loans relative to its deposits (that is, it buys very few bonds) and because many of these loans are not directly comparable to loans bought and sold by other banks – I want to stress lending as a key function of Truxton when discussing it with you. I think that lending at Truxton matters a lot more in terms of deciding whether or not to buy the stock than lending would matter at say Frost (CFR).
With that discussion of Truxton’s lending out of the way – we can now talk about the historical growth rates in both Truxton’s loan book and its assets under management.
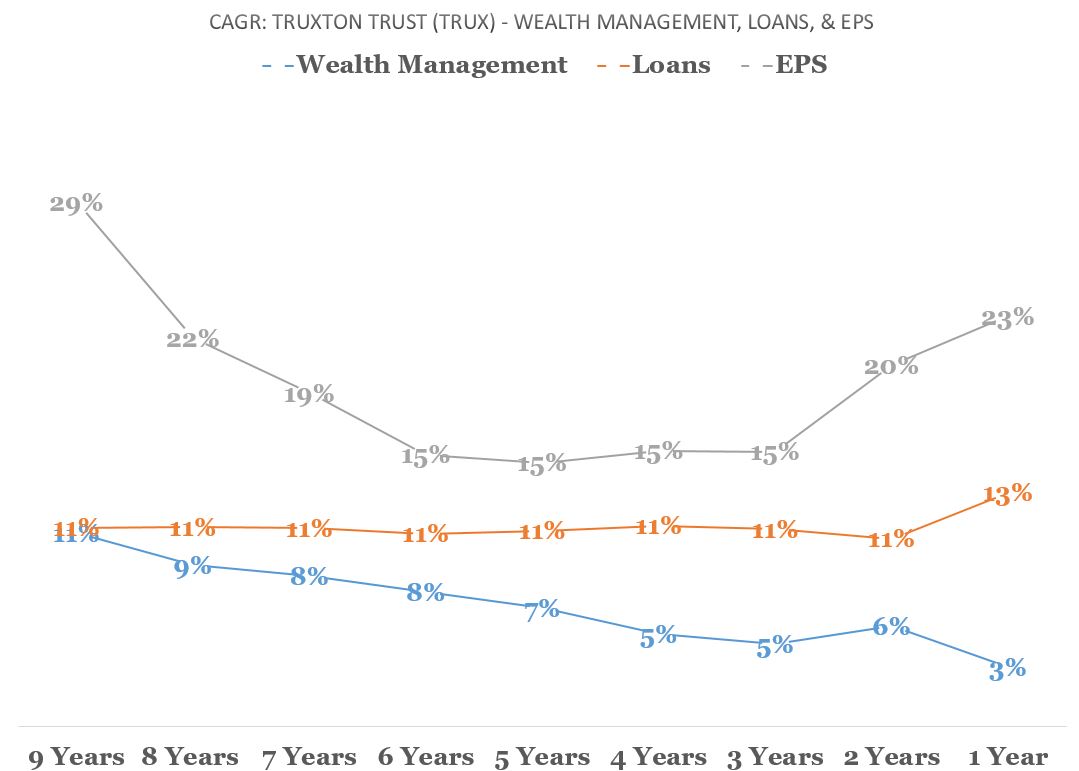
What we want here is the “central tendency” as Ben Graham would put it. If you look at the graph above, you can see that over the last 3-8 years Truxton has grown assets under management by 6-9% a year. We can use that as the historical growth rate in the asset management business. Note that the S&P 500 has obviously grown a lot during this period. However, as I’ll show you later – the relationship between the S&P 500’s growth in any one year and Truxton’s assets under management growth in that same year is very, very low. There’s not much of a correlation. So, it’s unlikely Truxton’s asset growth has come largely from increasing stock portfolio values for clients.
The growth in loans has been steadier than the assets under management growth. If we look at this same chart again you’ll see that loans have compounded at about 11% a year regardless of what years we measure from (the last 3 years, last 6 years, last 9 years, etc. all give us this same 11% a year growth rate). It’s interesting to note that loan growth in the U.S. – though perhaps not in Nashville where Truxton is located – has been quite low throughout this period. So, it’s possible that the 11% a year compound growth rate in loans would have been even higher if not for cyclical factors. I don’t think that’s true – because, there’s a big difference between loan growth and loan demand growth. A bank is limited in making loans by the amount of deposits it has and the leverage ratio (how much equity it is keeping relative to total assets) it wants to have. Basically, the higher a bank’s return on equity and the lower its dividend payout ratio – the higher loan growth can be. Conversely, the lower a bank’s return on equity and the higher its dividend payout ratio – the lower loan growth has to be. Here, I think Truxton has seen ample demand for loans to make all the loans they wanted. This is one reason why the compound annual growth in loans has been so stable. It’s not a measure of loan demand. It’s a measure of the actual loans Truxton makes. So, all we are really seeing is that Truxton hasn’t had any shortage of loan demand over the last decade – and Truxton is capable of growing loans by 11% a year given its level of profitability. In some years, there was probably enough loan demand for Truxton to grow 30% a year and in other years, maybe there was only enough loan demand to grow loans 15% a year. However, this kind of fluctuation wouldn’t show up in Truxton’s actual loan growth – because a bank’s actual loan growth would always be effectively capped by the sustainable rate of growth at the bank. In the long-run, a bank’s sustainable rate of growth is: ROE * (1-Dividend Payout Ratio). So, a bank with a roughly 18% return on equity and a roughly 33% dividend payout ratio would have a sustainable growth rate of 18% * (1-0.33) = 18% * 0.67 = 12%. Now, the actual rate of growth in loans would be limited by the rate of growth in deposits. But, the leverage neutral growth in deposits would be the growth in equity. So, what I’m saying is that if a bank earns 18% on its book value and pays 6% of book value as a dividend – that bank probably only wants to grow deposits by 12% a year and thus can only grow loans by 12% a year. In the long-run – though this will not hold true in any one particular year – a bank’s sustainable growth rate in loans is simply ROE times one minus dividend payout ratio. Or, to put it in the simplest terms – a bank’s loans shouldn’t grow faster than a bank’s retained earnings.
Based on that graph, you could say that Truxton’s past history would suggest that earnings will increase by some blended rate of assets under management growth (historically 5-9% a year) and loan growth (historically 11% a year). Long-term, Truxton’s earnings per share should – due to growing economies of scale – grow somewhat faster than the underlying growth in assets under management and loans. So, if you expected the future growth rates at Truxton in those things to be the same as the past rates – you’d expect EPS growth somewhat greater than 5-11% a year. This matches other ways of trying to adjust for the tax cut at Truxton. If we look at what the bank probably would’ve compounded EPS by over the last 3-6 years if there had been no reduction in the corporate tax rate – I’d say it would’ve been in the 8-12% a year range. What we are seeing here over and over again is above nominal GDP growth rates – so Truxton can grow faster than the U.S. economy – but, not much above 10% growth rates. Historically, the bank has grown by more than nominal GDP but no more than about 10% a year. If you assume nominal GDP growth in the future will be 5% a year, you could assume Truxton will grow between 5-10% a year for a very, very long time.
You can check this math yourself. Look at Truxton’s current ROE. And look at Truxton’s current dividend payout ratio. Is ROE * (1-Dividend Payout Ratio) greater than the top end of that growth range I discussed above (10%). If so, than Truxton can – if it keeps its ROE this high or higher in future years – grow at 10% a year without needing to cut its dividend. In fact, as you’ll see by doing that math, it might be possible for the bank to grow loans (and thus EPS) a bit faster than 10% and/or increase its dividend payout ratio a bit beyond where it is now.
As a shareholder, there’s a pretty simple way of thinking about this. You can view the dividend yield of the stock as all you are getting in value this year. However, you are also getting the growth in the dividend yield over time. So, let’s say you are buying at a 2.4% dividend yield today. That’s the same as buying a stock with a P/D (not P/E) ratio of 42. That sounds like a very high price to pay for any stock. But, let’s consider the math I’ve laid out here. It seems that Truxton’s dividend could grow by more than 10% a year – in the past, loans have grown at 11% a year – in the future. In fact, we know that EPS should grow a bit faster than actual loans because this is still a very small bank that will benefit from a lot of improving economies of scale over time as it grows. We also know that if the bank doesn’t grow loans as fast as it has in the past – the high ROE at the bank means it would need to increase its dividend payout ratio to keep its leverage ratio from dropping. Another way of putting this is that dividends per share will rise faster than earnings per share. In fact, this is often what happens at banks with slowing deposit growth, loan growth, etc. As the bank grows slower, ROE does not decline. Therefore – using the formula we discussed above – the bank ends up increasing its dividend payout ratio. If a bank pays out more of its earnings to you as those earnings grow – dividends will grow faster than earnings. All of this suggests we are looking at a stock where dividends per share could rise by more than 10% a year while you own the stock.
How much is that kind of growth worth?
It depends. Really, it depends on 4 things. One, are you willing to own this stock pretty much forever? If the answer to that is no – then, you can’t pay much for growth. It’s only safe to pay a high price for growth if you are willing to own the stock while it experiences that high growth. It may not turn out to be necessary to stick with the stock for a long time. It’s possible you won’t need to own it for that long. But, you need to be willing to. Because there is no guarantee the stock’s multiple expansion will provide your needed profit here as it often does in a value stock. Two, the quality of the growth – that is, the profitability of the business – has to be high. Here, it is. There are a lot of ways to measure how profitable growth is. But, the best way is to think of the needed addition to retained earnings – how much more actual cash a company has to put down today to fund future earnings growth – versus the increase in earnings. At a bank, inflation is relatively unimportant. The ROE you see is pretty close to the cash-on-cash economic return the business is getting. So, if a bank has an ROE of 20%, it only needs to retain about 5 cents per share of earnings to increase EPS by 1 cent next year. The rule of thumb to keep in mind is that you need the (cash) return on retained (cash) earnings at the business you are invested in to exceed the return in the S&P 500. If the stock market is going to return 9% a year – you don’t want to hold any stock that is retaining earnings of more than 10 cents per share to generate 1 cent per share in additional EPS. You need to get a 10%+ ROE in a world with a 9% stock market return to know that growth at the company you are invested in is actually adding value. Another way to think of this is that each dollar of retained earnings has to add more than one dollar of market value to the stock. In the short-term, this isn’t a reliable test. In the long-term, it is. Here, we know Truxton’s ROE is safely far, far above 10% a year. As long as it stays far, far above 10% a year – this is good growth we want to participate in (at the right price). The third thing that matters for growth is how reliable it is. How sure are we of this growth? Bank growth tends to be very, very certain compared to growth at some tech company, retailer, etc. So, Truxton scores well on that. Finally, we have perhaps the most important – and most difficult to answer – question: how long will this growth last?
A stock that is going to grow 10% a year for the next 30 years is worth a lot more than a stock that is going to grow 10% a year for the next 3 years. Which one is Truxton?
I gave the example of Frost. Frost is one of the biggest banks in Texas (it is the biggest headquartered there). But, it is only in Texas. Just one state. There are many banks bigger than Frost. So, the theoretical limit of possible size for a tiny bank in the U.S. is certainly no smaller than the current size of Frost. We can then ask the question: if Truxton grew 10% a year each and every year – how long would it take for Truxton to reach the size Frost is now?
The answer is about 40 years. This doesn’t take inflation into account. And it certainly doesn’t take size versus GDP into account. Over time, the banking industry in Nashville, in Texas, in the U.S, etc. should grow about as fast as the GDP of those places. This means that if Truxton were to grow 10% a year for the next 40 years – it’d actually still be much, much smaller than Frost is today when adjusted for inflation, bank’s size versus total size of the U.S. banking market, etc. Obviously, Frost is also an arbitrary choice. I could’ve picked Wells Fargo which is many, many times bigger. My point here is just that there’s no reason why a bank the size of Truxton would be limited in its growth any time within the next 30 years. Even if it grows at 10% a year – it could keep growing that fast for the next 50 years and still be nowhere near one of the biggest banks in the country. Will Truxton ever get that big? No. It almost certainly won’t. But, the reason for that will be internal rather than external. The market is big enough for a tiny bank like Truxton to grow 10% a year for the next half century. Most tiny banks won’t grow that fast. That’s because most banks won’t have the right business model, culture, strategy, and management to grow that fast. It’s not because the market isn’t big enough to allow that kind of growth. So, at a rate of 10% annual EPS growth – I see no external limit to Truxton’s growth prospects within an investor’s lifetime.
Here I need to pause and talk about growth in assets under management. You may have noticed in that graph that Truxton’s assets under management have often grown in like the 5-10% a year range. That sounds good. Sounds fine compared to GDP or something like that. But, it’s actually not very fine compared to the S&P 500. Over the last 10 years, the S&P 500 has grown nearly 15% a year. Meanwhile, Truxton’s 9-year growth rate in assets under management has been just 11% a year. Does that mean Truxton hasn’t added any clients over time – and instead clients have been withdrawing their assets at a rate of like 4% a year?
No. The correlation between Truxton’s growth in assets under management and the growth in the S&P 500 has been very, very low. For example, in a year (2014) when the S&P 500 didn’t grow at all – Truxton’s AUM grew 14%. The same thing happened in 2011 (no growth in the S&P 500, but 17% growth in Truxton’s AUM) and in 2018 (S&P 500 down 6%, Truxton’s AUM up 8%). There’s no indication that Truxton’s AUM growth is closely tied to the S&P 500. In years when the S&P 500 does well, Truxton’s AUM growth lags the market. In years where the market is flat or down – Truxton still grows AUM at about the same rate as it does in years that are good for the market. There’s just no meaningful relationship between the return in the S&P 500 and Truxton’s assets under management. There are many possible reasons why this is. The biggest is simply that Truxton’s clients may have a lot of money in real estate, private equity, hedge funds, municipal bonds, corporate bonds, and government bonds as well as in the S&P 500. The other factor is that client decisions to increase or decrease the amount of money they have Truxton manage may be a bigger factor than the return Truxton gets on the assets entrusted to it. Finally, remember that the bank is called “Truxton Trust” and not just Truxton. It’s a lot more likely that Truxton’s AUM on which it charges fees includes kinds of assets – in the trust – that would not be a normal part of an asset manager’s (in the sense of a pure stock or bond picker’s) assets under management.
So, I think we have to say Truxton – like any wealth manager – must have benefited from the rise in the value of the S&P 500 over these last 10 years. This must have helped Truxton grows its assets under management. However, the rise in the S&P 500 probably helped Truxton a lot less than it helped most wealth managers. So, it may be easier for Truxton to keep AUM growing even in a down stock market than it is for many other wealth managers.
Now, we need to consider how this past growth record of double-digit annual EPS gains was achieved. Was Truxton’s past growth record achieved during a time of cyclical headwinds, cyclical tailwinds, or cyclically typical times in banking?
Certainly, the period from 2009-2018 was not cyclically typical. It was one of the most atypical times in banking in the last 30 years or so.
So, we know cyclical factors played a part in Truxton’s past record. But, the part they played isn’t as easy to quantify as you might think. In fact, cyclical factors in U.S. banking may have exaggerated Truxton’s good record in one respect and held back its record in another. So, we need to consider cyclicality in two respects here. One, we know that Truxton’s past growth is actually a lot more impressive than it appears because the credit expansion from 2009-2019 was very mild in the U.S. It wasn’t much of a banking boom. Secondly, we have to consider interest rates. There are two ways to think about interest rates at Truxton. One – as I write this – the Federal Reserve is expected to cut the Fed Funds Rate at its next meeting. Regardless of how much and how often the Fed cuts rates this year, longer-term yields on many securities and loans have already fallen. This could pressure Truxton’s net interest margin next year versus last year. Compared to many banks, I don’t think this is a big issue at Truxton. It’s not a very interest rate sensitive bank. I’ll discuss why that is later. But, trust me for now when I say that predicting future interest rates is not as important in figuring out Truxton’s earning power as it would be at a bank like Frost that has a lot of non-interest paying deposits funding a lot of municipal (and other) bond purchases. Truxton pays more interest on its deposits and loans more of its deposits out than Frost does. So, it’s less interest rate sensitive. That brings us to the second way in which interest rate cyclicality needs to be considered here. The decade of results we see at Truxton is pretty impressive for any time period. But, it’s especially impressive for a period in which most U.S. banks have had trouble delivering good returns on assets. Truxton’s current ROA of 1.8% is extremely high for a U.S. bank. It’s especially high for such a tiny bank. Because Truxton isn’t especially interest rate sensitive – but still benefits a bit from lower short-term rates and higher long-term rates like basically all U.S. banks do – Truxton’s relative profitability versus other bank’s has probably been cyclically overstated these last 10 years. However, the bank’s absolute profitability has been a bit understated. Other banks would benefit more from higher interest rates. But, Truxton would have been more profitable this past decade if rates had been higher for more of that period. So, is Truxton as much better than Frost as it appears based on the ROAs of each bank during these last 10 years? No. But, would Truxton be likely to earn as high or higher an ROA during a period of higher interest rates? Yes.
Again, this makes it look as if the bank could either: continue to grow at 10% a year for a long time while paying its current dividend – or, raise its dividend payout ratio while growing slower. We may not be able to break out exactly how sensitive Truxton was to the cycle these past 10 years. But, we have enough evidence that it probably didn’t – on a net basis – benefit a lot over the last 10 years from economic conditions that won’t exist in most periods. The future may be a lot different than the recent past. But, there’s no reason to believe the recent past was a lot kinder to Truxton than the average of future years will be.
So, we could do a DCF with Truxton using a 10% growth rate and apply that to the current 2.4% dividend yield. Imagine you pay $100 today for a stream of cash that starts at $2.40 a year today and grows at 10% a year far out into the future. This year’s payment is $2.40, 2020’s payment is $2.64, 2021’s payment is $2.90 and so on.
We don’t actually have to do such a calculation. There’s a much easier way to decide whether Truxton is a bargain or not. We can just look at the very long-term history of U.S. stocks. We have data on the Dow Jones, the S&P 500, etc. If we take the Dow Jones over the last century or so – we’re talking about a group of stocks that have averaged about a 3% dividend yield and a 6% sales (per share) growth rate. We know that stocks today are more expensive than stocks were in the past. In other words, the Dow Jones today is unlikely to offer a 3% dividend yield and a 6% sales growth rate. The dividend yield may be lower. And the sales growth rate may be lower as well. Because the stock market has – on average – been cheaper in the past than it is today, we can use the long-term past average of the market as an especially conservative sort of opportunity cost test here. We know you can’t – through buying an index today – get as good a deal as investors got on average over the last century.
The long-term past average was for a 3% dividend yield growing 6% a year. Truxton today is offering you a 2.4% dividend yield growing 10% a year. It’s probably already a better deal than the Dow has tended to be in the past. But, that’s not immediately certain for two reasons. One – we know the Dow’s sales growth (because it’s a basket that gets re-shuffled) is pretty much a perpetual growth rate. If it can grow 6% a year for the next 5 years, it can probably grow 6% a year for the next 50 years too. We don’t know that about a single stock like Truxton. So, the length of time during which you’ll have growth could be longer with the Dow than at Truxton (though I don’t much believe this – there’s little reason for the Dow to grow faster than a bank). The other thing to consider is that Truxton’s dividend yield (at 2.4%) is below the long-term historical dividend yield of 3% on the Dow. Of course, Truxton’s growth rate is much higher than the Dow’s historical growth rate. But, you’d need to know what discount rate to apply to the stock today to see how much lower a dividend yield you can have now to buy greater growth (that is, a higher future dividend). I think most readers can see – without doing a DCF – that something yielding 2.4% and growing 10% a year is probably a better deal than something yielding 3% a year and growing 6% a year.
There is, however, a simpler solution. You could just wait till the point where Truxton would be yielding the same as the Dow has historically while also growing faster than the Dow. If Truxton stock paid the same dividend per share it does now but had a stock price 20% lower – it would have a 3% dividend yield. If the company’s growth hadn’t slowed you’d then be comparing something yielding 3% a year and growing 10% a year against something – stocks generally as represented by the Dow – yielding 3% a year and growing only 6% a year.
In other words, Truxton would clearly be a good investment at a price 20% lower than today’s price.
That is, if – and only if – you believe the company’s higher than average ROE, higher than average growth rate, etc. is sustainable far into the future.
That brings us to a description of Truxton’s business model. What makes Truxton unique? What is the culture like? What is this bank’s philosophy? Does the business model make sense? Can it endure for decades? And – more importantly – can Truxton be an above average bank for decades to come?
So far I’ve really only talked about Truxton as a bank generally. Now, I need to talk about what specifics about this bank make it different from other U.S. banks you’ve probably analyzed.
Truxton does two things: 1) it’s a “private bank” and 2) it’s a wealth manager.
The company has two locations. One is a combined bank branch, wealth management office, and headquarters in Nashville, Tennessee. The other is just a wealth management office in Athens, Georgia.
Deposits are about $400 million. Assets under management are about $1 billion.
Truxton’s return on assets (1.8%) is high compared to U.S. banks, because it has greater economies of scale. Truxton gets more dollar volume of business from each client, each branch, etc. Obviously, it does not cost twice as much to serve a client who deposits twice as much with a bank. Nor does it cost twice as much to run a branch with double the number of clients as another branch. A fair amount of branch expenses are fixed regardless of the number of clients served by that branch. And a fair amount of per client expenses are fixed regardless of how rich or poor that client is. As a result, it’s more profitable for a bank to have fewer clients and fewer branches while having the same total AUM, deposits, loans, etc. as a bank with more clients and more branches.
U.S. banks as a group have about $50 million in deposits per branch. One of my favorite banks – and a good deposit gatherer, Frost (CFR), – has about $200 million in deposits per branch. Truxton has $400 million at one branch. As a result, the company’s occupancy cost (rent) as a percent of deposits is lower than banks 10, 100, and even 1,000 times its size.
Likewise, the company has only one dedicated wealth management location and two wealth management locations in total – yet, it has $1 billion in assets under management (so, $500 million in assets per office). Some of these assets belong to insiders. My best guess is that insiders account for a little over $50 million of assets under management.
How does Truxton gather so much money in so few locations?
Truxton is a “private bank”. In other words, it has rich clients.
Truxton gets more than half of its funding from large accounts. My definition of a “large account” is a single bank account with more than a $250,000 balance. I use this number because the FDIC doesn’t break down accounts by size once they exceed the $250,000 limit. The average (mean) size of a “large account” at Truxton is $1 million. So, I would say more than half of Truxton’s deposits are kept in large accounts that average about $1 million in size. Note that the same client – or closely related entities like a household, a business owned by the head of that household, a foundation created by the head of that household, etc. – may have multiple accounts. So, it’s possible that many individual relationships at Truxton result in average deposits at the bank of greater than $1 million.
Of course, Truxton’s average size for all accounts – not just large accounts – is much, much lower. But, I don’t think this is meaningful to our discussion. I think it’s more meaningful to say that a small group – of less than three hundred clients – provides most of the funding ($300 million) to Truxton’s bank.
I said earlier that I’d explain why Truxton isn’t as interest rate sensitive as a bank like Frost. These deposits are why. If you have a small number of big deposits from some very rich clients – those deposits are going to be in the form of money market accounts. Truxton is basically funded entirely by money market accounts. These pay interest. And they will pay more interest the higher short-term interest rates are. No one is going to leave $1 million on deposit at a bank and not expect to receive some interest for it. A commercial bank – like Frost – often provides a lot of services for a business and then allows that business to earn credits on its deposits that can be used to offset what the depositor would otherwise pay for in fees. Basically, the depositor gets paid in services – not cash interest. At Truxton, depositors are going to get paid in cash interest. As a result, higher interest rates won’t just mean higher yields on the loans Truxton makes – they’ll also mean higher interest payments from Truxton to its depositors. These two factors will offset much more so at a bank like Truxton than at a bank like Frost. So, Truxton will be less interest rate sensitive – that is, the bank’s earnings will be more similar regardless of where interest rates are – than a bank like Frost (which benefits more from higher rates).
So, now we know what a private bank looks like. It’s a lot of deposits at one branch supplied by a small group of very rich clients.
What does a wealth manager look like?
The answer to this is a little tricky. As a Focused Compounding member reading this – your mind really goes to a portfolio manager, a mutual fund, a hedge fund, etc. focused on buying stocks in hopes of outperforming the market. That is a wealth manager. But, that’s not really the game most wealth managers are playing. And I think it would be very, very misleading to go into an analysis of Truxton stock imagining that its wealth management clients chose Truxton because they think the folks at Truxton have a good shot of beating the S&P500. Truxton isn’t that kind of wealth manager.
Here a wealth manager is basically a customer service representative who focuses on serving a small group of rich clients. Using my own business – Focused Compounding Capital Management – as an example, a wealth manager is the person who calls up my partner Andrew and says he would like to put a portion of some (or all) of his clients’ money in accounts I manage. The wealth manager has the relationship with the client (we, Focused Compounding Capital Management, don’t). He knows the client well. And he knows accountants, lawyers, and portfolio managers who can help the client well too. But, he’s a generalist. What he doesn’t have is expertise in a specialized area like picking specific stocks. So, he often outsources this task.
Truxton also employs more specialized employees. They have some of their own accountants, lawyers, and insurance agents. And there are people at Truxton with the job title “portfolio manager”. They don’t outsource all their investment decisions. But, it’s very important to remember that Truxton has literally zero proprietary products. It doesn’t have any mutual funds. I don’t think of the business as being comparable to Hennessey Advisors, Pzena Investment, and other stocks you might look at when imaging a peer for an “asset manager.”
I believe Truxton charges clients about 0.08% of assets under management each month (1% per year). So, for every $1 million you have under management at Truxton, you probably pay about $800 a month.
I’ve been calling the company “Truxton”. The official name is “Truxton Corporation” for the parent company and “Truxton Trust” for the bank. There’s a reason the bank is called “Truxton Trust”. This bank has a huge trust business compared to other banks. If you look at everything the bank says, the FDIC reports, etc. – you’ll come away with the impressions that a lot of this bank’s overall business is probably related to its trust business. For example, the bank has very low amounts of retirement type investment accounts compared to other asset managers. And it has a lot of trust accounts. It also has a low compared to its overall size, but still quite high compared to most banks (which usually have almost no) foundation business. By going through the FDIC report, I could try to quantify the importance of trusts here – but, based on the corporate communications I’ve read, I think that’d be misleading. Trusts are probably especially important for Truxton in terms of leading to additional accounts, revenue streams, etc. Like I’ve said before that the general operating account of a business is key to Frost getting other deposit accounts and making loans to a specific business – having a trust relationship with a family is probably disproportionately important to Truxton’s long-term earnings compared to what the percentage of assets in trusts actually is.
As far as the culture and all of that – the company was created to focus on high-touch service to rich clients in the Nashville area. Most of the hiring the company has done – the exception would be the many hires of entry level people directly out of college – reflects this. The overall impression I get from everything I’ve read about Truxton is that it’s a customer service organization first and a sales organization – meaning in large part providing additional services to the same clients – second. At times, the company has said that most new clients come from referrals either from existing clients or from professionals – lawyers and accountants – of existing clients. Truxton has also mentioned that employees do not receive commissions. Again, this suggests a relationship (deposits, assets, etc.) focus instead of a products (transactions) focus. Incentives are probably to grow the total size of client relationships rather than to sell clients things.
While there is a lot of anecdotal information about Truxton’s culture – it’s pretty much all PR type stuff from the company itself. I’ve read corporate communications from the company, Glassdoor (employee) reviews, and local press reports. All of these have a heavy corporate PR element. What the company has communicated over the last decade is very consistent though.
My impression formed from the limited sources available is that Truxton is focused on customer service almost purely of the “relationship building” variety. A lot of the employees probably aren’t so much wealth managers or bankers as they are relationship managers.
On the investment side, there is nothing of note to report. I can’t find anything unique about Truxton’s approach to investing. I can’t find anything particularly wrong or right with it.
The lending side is also unclear. My guess is that it’s conservative. The bank has not written off any loans in the past. It has maintained a normal – for other banks making similar categories of loans – loan loss allowance despite not writing off loans. And the bank has also classified loans (meaning the bank is aware of reasons why loan payments wouldn’t be made and also – perhaps especially – why the collateral would be insufficient to recover the loan balance) that have then not been written off. From a purely quantitative perspective, it looks like a very safe loan book. It is overwhelmingly tied to real estate. And it’s probably tied to pretty big (relative to the bank) real estate loans. The biggest category is commercial real estate (not occupied by the owner). The second biggest category is home loans. These are probably for quite expensive homes. Some of them may be vacation homes or quasi-investment properties. Certainly, the residential mortgages Truxton has don’t match the kind of loans that GSEs buy. However, like I said, Truxton makes closed-end mortgage loans which shouldn’t be a riskier way (in fact, it’s theoretically a less risky way) to lend against homes that wouldn’t be appropriate for a conforming mortgage. Finally, the bank does have a bigger portfolio of consumer loans to rich people than is common. Some of these loans are probably for quite typical things like automobiles. But, other loans are probably for things like art. That’s not a category most banks do any meaningful amount of lending against. Far, far more of Truxton’s loans are some kind of “secured” loan than you’ll see at most banks. Basically, there is some kind of collateral (an office building, an apartment building, a full-time home, a vacation home, a car, a painting, etc.) backing the loan than at most banks. Truxton doesn’t do as much “commercial and industrial” lending to businesses as the more commercial banks around the country do and it doesn’t do as much credit card lending (it doesn’t do credit card lending at all) as the more consumer oriented banks do. Overall, it’s a lot of real estate lending. The unusual risks in the portfolio are a big concentration in commercial real estate (presumably in the Nashville area) and a big concentration in mortgages on high priced homes. Since Truxton hasn’t written off a loan in a long time, its historical loss record is obviously much better than virtually all U.S. banks. It hasn’t had losses yet. While that’s an important data point, I don’t want to overstate it. Truxton has served rich clients in the Nashville area during a decade long economic expansion. The city Truxton is in, the type of clients Truxton serves, and the nationwide macro-economic situation all say this is a time when you shouldn’t be writing off loans. So, I think the fact Truxton hasn’t had loan losses in the past is likely to leave too strong an impression of an ultra-conservative, ultra-skilled lender in your mind. A record of no losses can’t be beat. So, there’s nothing negative here. Personally, I feel sure the lending here has – so far – been at least average and almost certainly better than average in terms of conservativism. But, I’m not willing to go further than that. There will be loan losses in the future. The past record won’t last.
There are some indications that Nashville is a hot lending market for construction and real estate. I don’t know anything about that. It would be something to look into further. If true, it could mean that Truxton’s yields on its loans and its likely future losses will be different in future years than they have been in the past. This is something to keep an eye on.
The quantitative record at Truxton is excellent. The culture looks good. They say all the right things. A bank this small has an investor’s lifetime of potential growth ahead of it. The stock price isn’t high now. And there’s no way you could argue the bank isn’t cheap enough if the stock was to drop 20% in price (that is, trade at a 3% dividend yield).
This is one to watch.
Truxton goes straight to the top – or at least very, very near the top – of my idea pile.
Geoff’s Initial Interest: 80%