Under Armour (NYSE:UA)
UPDATED: 20-JUN-2017
Athletic apparel manufacturers typically develop, market, and distribute their own branded apparel, footwear, and accessories for men, women, and youth. Products are usually sold worldwide and worn by athletes, as well as by consumers of active lifestyles. Products are most often marketed at multiple price levels with revenue generated from a combination of wholesale sales to independent and specialty retailers, as well as through direct consumer sales channels that include a company’s own stores and its ecommerce sites.
The key players in the industry are NIKE (includes Jordan & Converse which was acquired in 2003), Adidas (includes Reebok which was acquired in 2005), Under Armour, PUMA, and ASICS. Below is my estimate of the market size and industry market shares:
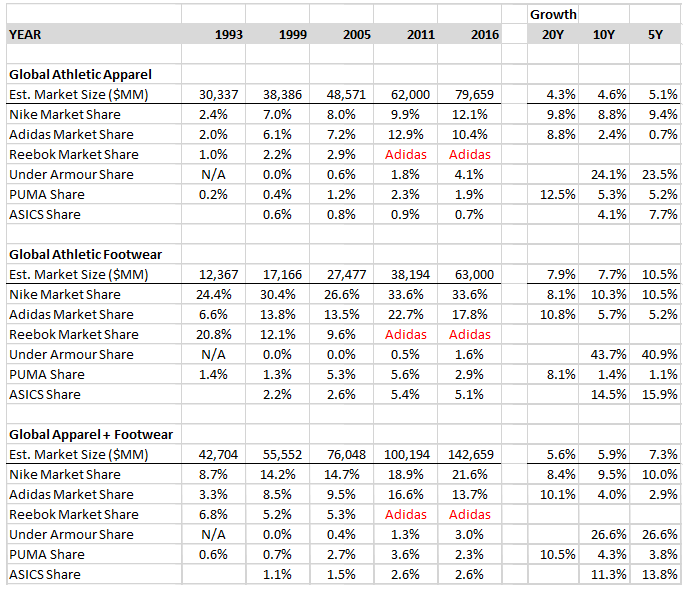
The industry is currently benefiting from a number of consumer trends, including an ongoing shift towards living healthier, a shift to more casual work and everyday apparel, global growth in sports activity, and a growing middle class in China and other emerging markets. Other trends that appear to be affecting the industry are growth in Direct-to-consumer sales and a tendency for consumers to develop brand loyalty at a young age.
The athletic apparel industry is very durable with athletics traced back to 2250 BC. People often seek to belong to a group and are typically loyal to their favourite athletic brands. Over the long-term, the industry should be capable of growing sales at rates at least as fast as the global GDP growth rate (ie. ~4.5%+), and faster, if the current trends discussed previously, endure.
The economic moats of an athletic apparel company is based on its brand strength and how well it resonates with consumers. Protecting a company’s brand and growing its appeal/popularity is crucial to mass-market success. Endorsement deals with popular sports teams and athletes are often critical to brand success. NIKE dominates industry endorsement spending, sponsoring 70% of the most valuable sports teams and 45% of the top athletes. Adidas has the second most top endorsement deals (~15-20%) followed by Under (~10-15%).
In the past, the industry has offered good fundamentals and good stock returns. Below is a table of the fundamental & price performances over the last 9 years for each of the industry’s key players:
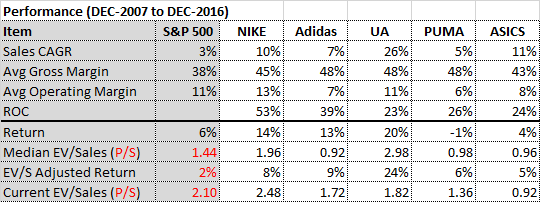
Currently, within the industry, Under Armour appears to be the most likely candidate for mis-pricing. The stock has dropped approximately 50% in the past year and is trading near its historical low EV/Sales ratio. As part of the 3Q2016 earnings call, management warned investors that sales growth would slow over the next two years, and then, after 26 consecutive quarters of >20% sales growth, Under Armour’s streak ended in 4Q2016 with sales growing by 11%. They followed up with 1Q2017 year-over-year sales growth of 6.6% (including North American sales dropping 1%, wholesale revenues increasing 3.8%, footwear sales up 2.0%, and Connected Fitness sales up 2.3%). Meanwhile, SG&A expenses increased 11.7%.
So, the key questions are: What has caused Under Armour’s recent struggles and are they temporary or permanent? And, what kind of return does the stock offer?
Regarding the cause of Under Armour’s recent struggles, in the 4Q2016 earnings call, management said: “In the fourth quarter, slower traffic caused significant promotional activities earlier, deeper and broader than expected.” In the 1Q2017 earnings call, management offered the following: “while the Curry 3 plays very well on-court for Stephen Curry and our athletes, a sluggish signature market, and a warm consumer reception, has led to softer-than-expected results.” Management also cited a hangover from The Sports Authority’s 2016 bankruptcy. Essentially, Under Armour management is blaming a slowing U.S. retail environment, promotional pricing by competitors, and poor sales / inventory management related to their most popular shoe brand. The slowing U.S. retail environment and promotional pricing argument makes sense based on the latest quarterly results for the industry which show U.S. sales growth of less than three percent for all of Dick’s Sporting Goods, Foot Locker, NIKE, and ASICS in addition to Under Armour. Other possible explanations include a shift towards leisure and retro brands, and a brand that may be fading in the eyes of consumers. The latest quarterly results of Adidas and PUMA, combined with scuttlebutt research I’ve done on youth trends, suggest that the retro brands argument holds water. The recent popularity of classic shoe collections like the Adidas Superstar line or the PUMA Suedes series, while in the short-term is bad news for competing shoe brands, is also cyclical. However, the possibility of a fading brand, is much more worrying prospective Under Armour investors because it calls into question the brand’s durability, and ultimately, the company’s competitive advantage. My research on brand durability suggested that the brand remains strong with most demographics, but is weakening with teens. I spoke to a number of sales clerks manning the cash registers at my local stores, and the feedback seemed to agree that the Under Armour brand was doing well, even slightly outselling the competition in apparel while slowly gaining traction in footwear. However, discussions at those same stores as well as among the youth I know, also confirmed that Under Armour is much less popular athletic leisure brand among high school students. So, my key takeaway from Under Armour’s current struggles is that I’m most worried about the brand’s long-term sustainability with teenagers; the remaining risks, I believe are acceptable.
Regarding valuation, due to the stability of the industry’s gross margins, I feel comfortable valuing the industry players based off EV/Sales multiples. Before looking at the most likely scenarios, let me start by looking at the downside. The key risk to the thesis is degradation to Under Armour’s brand. Two possible comparisons for a weakened Under Armour brand might be Converse (which was sold in 2003 to NIKE for $305MM in cash & debt, resulting in an EV/Sales multiple of 1.48x on its $205MM in sales) or Reebok (which sold in 2005 to Adidas for $3.8B, resulting in an EV/Sales multiple of 1.18x on its $3.2B in sales). If the brand is impaired, sales growth would grind to a halt and possibly decline. Unfortunately, I have no crystal ball to forecast what that sales profile might look like, so I think the current year’s sales figure seems like the most reasonable guess of what sales figures could plateau at. So, let’s estimate the downside case at TTM sales of $4.895B * EV/Sales multiple of 1.18x for an Enterprise Value of $5.77B, and an estimated loss of 40%.
In the more likely case, of an enduring brand, I feel comfortable using EV/Sales multiples adjusted for sales growth and operating margins; however, that methodology is best suited for stable margins and sales growth. In the short-to-medium-term, you’d expect Under Armour’s growth rate to exceed that of the industry; thus, it’s important to estimate the growth runway. By my estimates, Under Armour currently has a 4.1% market share of the $79B global athletic apparel market and a 1.6% market share of the $63B global athletic shoe market. If the brand endures, based on the historical market share growth rates of NIKE and Adidas, I estimate that Under Armour could reach 12% of the global market share for athletic apparel, and 6% of the global market share for athletic shoes within 15 years. Furthermore, it makes sense to me that both markets should be able to grow at GDP type rates of around 4.5% per annum. These estimates would result in Under Armour having a 12% share of a $153B global athletic apparel market and 6% share of a $122B global athletic shoe market within 15 years. Thus, I’m suggesting Under Armour could grow sales from its FY2016 total of $4.825B ($3.229B Apparel + $1.011B Footwear + 0.585B Other) to a total of $26.812B ($18.360B Apparel + $7.320B Footwear + $1.132B Other) by FY2031 for a CAGR in sales of 12.1%. In a low EV/Sales case scenario (ie. A normal interest rate environment that causes market valuations to revert to their historic long-term averages), I would estimate that a company like Under Armour (with typical operating margins of 10.5%), and a long-term industry average sales growth of 4.5%, would fetch an EV/Sales of at least 1.30x. Therefore, under a low case scenario, without getting dividends or buybacks, the stock could return 9.6% per annum over 15 years (buy @ $4.825B * 1.82x and sell @ $26.821B * 1.30x). In a medium EV/Sales case scenario (ie. Today’s low interest rate environment that has caused high market multiples), I would estimate that a company like Under Armour would fetch an EV/Sales of 2.80x. Therefore, under a medium case scenario, the stock could return 15.4% per annum over 15 years (buy @ $4.825B * 1.82x and sell @ $26.821B * 2.80x).
In conclusion, the athletic apparel industry is an attractive industry for investors to shop in. After a track record of impressive and consistent sales growth, Under Armour has stumbled in its last 2 quarters, causing a mass sell-off of its shares that have driven the price down by around 50% over the last year. I believe that most of the causes of recent poor performance are either temporary or cyclical in nature; however, the brands dropping popularity with fickle teenagers could be problematic if it endures. If the brands strength is intact and sustainable, Under Armour shares should perform well by offering returns ranging from 9% to 15% over the next decade or more if the brand endures, but if the brand fades, investors should expect a loss of 40% on their investment.
Disclosure: I do not own a position in any of the securities mentioned.