Posts In:

Andrew Kuhn September 26, 2019

Calculating Free Cash Flow: 5 Illustrated Examples From Actual 10-Ks

Some readers have emailed me with questions about exactly how to calculate free cash flow, including: Do you include changes in working capital? Do you really have to use SEC reports instead of finance websites?

Yes. You really do have to use EDGAR. Finance sites can’t parse a free cash flow statement the way a trained human like you can. As you know, I’m not a big believer in abstract theories. I think you learn by doing. By working on problems. By looking at examples.

Here are 5 examples of real cash flow statements taken from EDGAR.

We start with Carnival (NYSE:CCL).
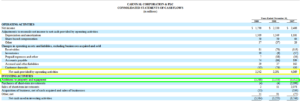
Notice the simplicity of this cash flow statement. It starts with “net income” (top of page) and then adjusts that number to get to the “net cash provided by operating activities” (yellow). To calculate free cash flow in this case you just take “net cash provided by operating activities” (yellow) and subtract “additions to property and equipment” (green). The result is free cash flow.

As you can see, Carnival produces very little free cash flow. Free cash flow is always lower than net income. That’s because cruise lines are asset heavy businesses like railroads. They have to spend a lot of cash to grow. Carnival’s reported earnings tend to overstate the amount of cash owners could actually withdraw from the business in any one year.

Carnival is our example of a “typical” cash flow statement. There’s really no such thing. But this one is simple in the sense that you only have to subtract one line “additions to property and equipment” from “net cash provided by operating activities” to get Carnival’s free cash flow.

Next up is Birner Dental Management Services (OTC:BDMS).
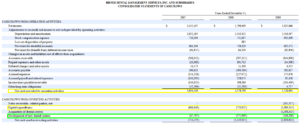
Notice how Birner separates capital spending into two lines called “capital expenditures” and “development of new dental centers”. This is unusual. And it is not required under GAAP (Generally Accepted Accounting Principles). However, it’s very helpful in figuring out maintenance capital spending. If you believe the existing dentist offices will maintain or grow revenues over the years, you only need to subtract the “capital expenditures” line from “net cash provided by operating activities.” But remember, any cash Birner uses to develop new dental centers is cash they can’t use to pay dividends and buy back stock.

Now for two cash flow statements from the same industry. Here’s McGraw-Hill (MHP) and Scholastic (NASDAQ:SCHL).
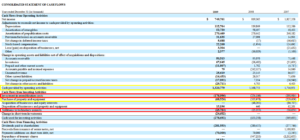
These are both publishers. And like most publishers they include a line called “prepublication and production expenditures” or “investment in prepublication cost”. Despite the fact that these expenses aren’t called “capital expenditures”, you absolutely must deduct them from operating cash flow to get your free cash flow number. In fact, these are really cash operating expenses.

For investors, this kind of spending isn’t discretionary at all. It’s part of the day-to-day business of publishing. I reduce operating cash flow by the amounts shown here. At the very least, …

Read more
Warwickb September 12, 2019

Ardent Leisure Group Ltd (ASX:ALG): Initial Interest Post and Request for Scuttlebutt

Posted by: Warwick Bagnall

ALG consists of two main parts; the Dreamworld/White Water World theme park in Queensland, Australia and the Main Event chain of family entertainment centres in the US.  I’m interested in ALG mainly to try and understand why it is the largest position (>20% and growing) of a value/activist LIC (Ariadne Australia Ltd, ASX:ARA) which I hold.  ALG is cheap compared to its past share price and on a (depressed) P/S basis but it has been loss making since 201. Hence this write-up is part of a reverse-engineering exercise.


ALG’s financials take a lot of work to understand.  By that I mean that the reporting is complete and efforts have been made to attribute costs and revenue clearly.  However the company has recently sold business segments, changed from a stapled structure to a simple company, is dealing with a major safety incident (below) and has opening new stores.  There’s a lot going on in the accounts.


When ARA went activist they published a plan for realising the value in ALG.  The plan addressed ALG’s management and operational shortcomings and suggested a final valuation of at least AUD 3.58 versus the current share price of AUD 1.05.  That’s fine as a start but it doesn’t address the main things I want to understand – who visits ALG’s businesses, why do they visit, how robust is the business model and will there be any worthwhile growth?


The theme park segment of the business is loss-making due to a fall in visitor numbers and per-capita spend following an incident involving one of the rides in 2016 in which several people died.  The inquest into the incident concluded last year (2018) but the final report hasn’t been released yet. ARA gained control of the board in 2017 and significant improvements in safety, operations and per-capita spend have since been made.  


The park has a similar catchment size and scale to a typical Six Flags park but has more competition in the form of a nearby Warner Bros. Movie World and Sea World plus some smaller attractions. Fortunately, the area where the park is located attracts a lot of tourists year-round and there are few, if any, comparable parks left in Australia.  People travel to the area from other states to holiday so the number of potential customers is likely higher than what the surrounding population catchment would indicate. Now that per-capita spend has increased, if park attendance returns to 2016 levels then the parks segment should be profitable. Even if this doesn’t happen the stock is valued such that the market seems to be pricing the parks segment at less than the value of the underlying land.


The Main Event chain is much more interesting.  Main Event is headquartered in Plano TX, has 42 sites and plans to open around five more each year.  An average store does USD 7.4 MM in revenue at an EBITDA margin of 33% and ALG claim the first-year ROI on new stores is around 41%

Read more
Ney Torres September 11, 2019

A Different view on Fannie Mae (FNMA) and Freddie Mac (FMCC) “Optionality has value”!

A Different view on  Fannie Mae (FNMA) and Freddie Mac (FMCC), an issue is rather complex. 
Here I may refer to both institutions as “government-sponsored entities” or (“GSEs”).

But YOU as an investor should focus on what’s knowable and controllable.
Here is what the market is missing an my variant perspective: “Optionality has value”!

Here is my invitation to you investor: see Fannie Mae and Freddie Mac at current price as an option, that could go to $0 or to $17.55 each. You would really be paying for the optionality.
You just bought an option, but not only that, this one doesn’t expire. 

how much would that option be worth?
for a “know nothing about the company” kind of investor using a Black an Scholes kind of formula works pretty well. Even though we don’t want to use it for prolonged periods of time, since the formula stops working basically.

Charlie Munger on Black Scholes Option Pricing Model (2003) –  https://www.youtube.com/watch?v=Fd4lfVNJljk

we need some assumptions: – http://www.iotafinance.com/en/Black-Scholes-Option-Calculator.html

Calculation results

Option price
$2.88
Days to option expiry
2557

That means you are getting $2.77 for free in the a $3.2 stock.

Now all of the reading, research, news, video calls, etc etc any work that you may put into understanding GSE’s will only affect the size of your position, due to your level of confidence (I use Kelly criterion calculator in binomial situations like this, where I think the value is either $38 or 0, I take about this later)

Let me summarize a very complex issue like this the best I can:

  • Under current conditions shareholders there WILL NOT be profits for shareholders ever, but shareholders have been pushing back with very good arguments, and now they are winning slowly.
  • Congress is almost 79.9% owner of the institutions though warrants 
  • Is in everybody’s interest to raise the price of the stock (remember the US holds a lot of warrants and needs to sell them)
  • GSE’s are out of riskier practices that caused their collapse and started making a lot of money.
  • GSE’s will make more income, because insurance for new loans are higher as time passes and old loans disappear.
  • Trump wants to capitalize the GSE before a recession.

The problem:

  • We don’t know how lawmakers are going to capitalize GSE again. In some hypothetical scenarios there could be significant dilution of current shareholders or even worst, that would mean you stock goes to $0 so fast that you won’t be able to exit your positions.

So what started moving the stock now?

Trump just came out with a plan to capitalize the company. And a lawsuit in favor of shareholders to put everything back on track. 
You see the Government has already been paid what they lend …

Read more
Andrew Kuhn September 6, 2019

EBITDA and Gross Profits: Learn to Move Up the Income Statement

“In lieu of (earnings per share), Malone emphasized cash flow…and in the process, invented a new vocabulary…EBITDA in particular was a radically new concept, going further up the income statement than anyone had gone before to arrive at a pure definition of the cash generating ability of a business…”

  • William Thorndike, “The Outsiders”


“I think that, every time you (see) the word EBITDA you should substitute the word bullshit earnings.”

  • Charlie Munger


The acronym “EBITDA” stands for Earnings Before Interest, Taxes, Depreciation, and Amortization.

A company’s EPS (which is just net income divided by shares outstanding) is often referred to as its “bottom line”. Technically, EPS is not the bottom line. Comprehensive income is the bottom line. This may sound like a quibble on my part. But, let’s stop and think about it a second.

If EBITDA is “bullshit earnings” because it is earnings before:

  • Interest
  • Taxes
  • Depreciation and
  • Amortization

Then shouldn’t we call EPS “bullshit earnings”, because it is earnings before:

  • unrealized gains and losses on available for sale securities
  • unrealized currency gains and losses
  • and changes in the pension plan?

I think we should. I think both EBITDA and EPS are “bullshit earnings” when they are the only numbers reported to shareholders.

Of course, EPS and EBITDA are literally never the only numbers reported to shareholders. There is an entire income statement full of figures shown to investors each year.

Profit figures further down the income statement are always more complete – and therefore less “bullshit” – than profit figures further up the income statement.

So:

  • EBITDA is always less bullshit than gross profit.
  • EBIT is always less bullshit than EBITDA.
  • EPS is always less bullshit than EBIT.
  • And comprehensive income is always less bullshit than EPS.

Maybe this is why Warren Buffett uses Berkshire’s change in per share book value (which is basically comprehensive income per share) in place of Berkshire’s EPS (which is basically net income per share). Buffett wants to report the least bullshit – most complete – profit figure possible.

So, if profit figures further down the income statement are always more complete figures, why would an investor ever focus on a profit figure higher up the income statement (like EBITDA) instead of a profit figure further down the income statement (like net income)?


Senseless “Scatter”

At most companies, items further up the income statement are more stable than items further down the income statement.

I’ll use the results at Grainger (GWW) from 1991 through 2014 to illustrate this point. The measure of stability I am going to use is the “coefficient of variation” which is sometimes also called the “relative standard deviation” of each series. It’s just a measure of how scattered a group of points are around the central tendency of that group. Imagine one of those human shaped targets at a police precinct shooting range. A bullet hole that’s dead center in the chest would rate a 0.01. A bullet hole that …

Read more
Andrew Kuhn September 5, 2019

Why Are U.S. Banks More Profitable Than Banks in Other Countries?

By GEOFF GANNON
09/05/2019

A Focused Compounding member asked me this question:

“Have you any thoughts on why U.S. banks are so profitable (the better ones at least)? I’ve looked at banks in other countries (the U.K. and some of continental Europe) and banks there really struggle to earn the spreads and returns on equity of high quality U.S. banks. This is particularly strange as the U.S. banking market is actually pretty fragmented, certainly more so than the U.K. which is dominated by a few giant banks and has a pretty non competitive deposit market. But U.S. banks seem to earn far better returns.

I was discussing this recently with someone who is a consultant to banks advising them in regulatory capital (among other things) and he said that it was down to the regulatory capital requirements being looser in the U.S. I’m really not convinced by that explanation though.
Is this something you’ve thought about at all?”

I don’t know if the regulatory requirements are looser really. There’s one aspect of regulation nothing about outside the U.S.: fees. It may be that U.S. banks are better able to earn non-interest income on fees (not sufficient funds fees, charging monthly fees for accounts below a certain minimum, etc.) then banks in some countries, because there might be tougher consumer protection rules in some other countries. However, from what I know of U.S. regulatory rules as far as capital requirements versus banks in other countries – I don’t really agree. It’s not that common for me to feel a bank in another country is a lot safer than large U.S. banks. So, if it’s a regulation advantage. It doesn’t seem to be an advantage due to forcing banks in other countries to be too safe.

The U.S. has FDIC. I don’t know what programs in other countries are like. Obviously, the FDIC program in the U.S. – combined with some other rules – helps minimize rivalry for deposits. An unsafe bank shouldn’t be able to draw deposits away from a safe bank just by offering high interest rates on deposits. And depositors shouldn’t abandon a bank they like just because they learn it may be about to fail. Obviously, before the FDIC and other rules – those were concerns which could mean the weakest operators in the industry would lower profitability for the strongest operators through irrationally intense rivalry for deposits.

Negative rates are bad for banks. There could be cyclical reasons for why you are seeing poor results in parts of Europe, because of that.

However, I need to warn you that it’s NOT true that small U.S. banks are more profitable than banks in other countries. They aren’t. It’s ONLY banks with good economies of scale in the U.S. that even earn their cost of capital. My estimate when I looked at U.S. banks as a group is that since about World War Two, they haven’t earned their cost of capital and they have earned returns below the S&P …

Read more
Andrew Kuhn September 3, 2019

Why You Might Want to Stop Measuring Your Portfolio’s Performance Against the S&P; 500

By Geoff Gannon

December 8, 2017


Someone emailed me this question about tracking portfolio performance:

“All investors are comparing their portfolio performance with the S&P 500 or DAX (depends were they live). I have asked a value investor why he compared the S&P 500 performance with his portfolio performance…for me as a value investor it makes no sense. A value investor holds individual assets with each of them having a different risk…it’s like comparing apples and oranges.

The value investor told me that…Warren Buffett compares his performance with the S&P 500. But I believe he did it, because other investors…expect it or ask for such a comparison.

How do you measure your portfolio success? Do you calculate your average entry P/E and compare it with S&P500 or Dow P/E to show how much you (over)paid for your assets? Or do you avoid such a comparison and calculate only the NAV of your portfolio?”

I don’t discuss my portfolio performance on this blog.

And I think it’s generally a good idea not to track your portfolio performance versus a benchmark.

It’s certainly a bad idea to monitor your performance versus the S&P 500 on something as short as a year-by-year basis.

Why?

Well, simply monitoring something affects behavior. So, while you might think “what’s the harm in weighing myself twice a day – that’s not the same thing as going on a diet” – in reality, weighing yourself twice a day is a lot like going on a diet. If you really wanted to make decisions about how much to eat, how much to exercise, etc. completely independent of your weight – there’s only one way to do that: never weigh yourself. Once you weigh yourself, your decisions about eating and exercising and such will no longer be independent of your weight.

Knowing how much the S&P 500 has returned this quarter, this year, this decade, etc. is a curse. You aren’t investing in the S&P 500. So, tethering your expectations to the S&P 500 – both on the upside and on the downside – isn’t helpful. The incorrect assumption here is that the S&P 500 is a useful gauge of opportunity cost. It’s not.

Let me give you an example using my own performance. Because of when the 2008 financial crisis hit, we can conveniently break my investing career into two parts: 1999-2007 and 2009-2017.

Does knowing what the S&P 500 did from 1999-2007 and 2009-2017 help me or hurt me?

It hurts me. A lot.

Because – as a value investor – the opportunities for me to make money were actually very similar in 1999-2007 and 2009-2017. In both periods, I outperformed the S&P. However, my outperformance in 2009-2017 was small while my outperformance in 1999-2007 was big. In absolute terms, my annual returns were fairly similar for the period from 1999-2007 and 2009-2017. It is the performance of the S&P 500 that changed.

Many value investors have a goal to outperform the S&P 500. But, is …

Read more