EM Systems: The Japanese Industry Leader in Pharmacy Software
Member write-up by Clayton Young.
Thinking Points
- EM Systems (TSE: 4820) is an industry leader in pharmacy software looking to leverage its strengths in closely related industries.
- The company’s biggest strength is its business model, which lowers industry standard system implementation costs and better aligns cost structure to its customers’ operating performance.
- Share price is a little elevated today at 1,398 yen per share (13.8 TTM EV/EBIT). Investors can reasonably expect an investment CAGR between negative 2.5% and 8.8% over the next three years.
Introduction
EM Systems (TSE: 4820) primarily develops, sells and maintains software geared for pharmacies. With a 26% domestic market share, the company is an industry leader. More recently, EM Systems started focusing on Medical systems (Electronic Health Record) and Nursing Care systems. By the end of fiscal 2019 (March 2019), the company aims to achieve market shares of 40% in pharmacy software, 10% in Medical systems, and 5% in Nursing Care systems.
The company has three reporting segments: Pharmacy, Clinic (Medical system), and Other (includes Nursing Care system).
During the fiscal 2017 reporting period, 81% of revenues and virtually all of operating profit came from the Pharmacy segment.
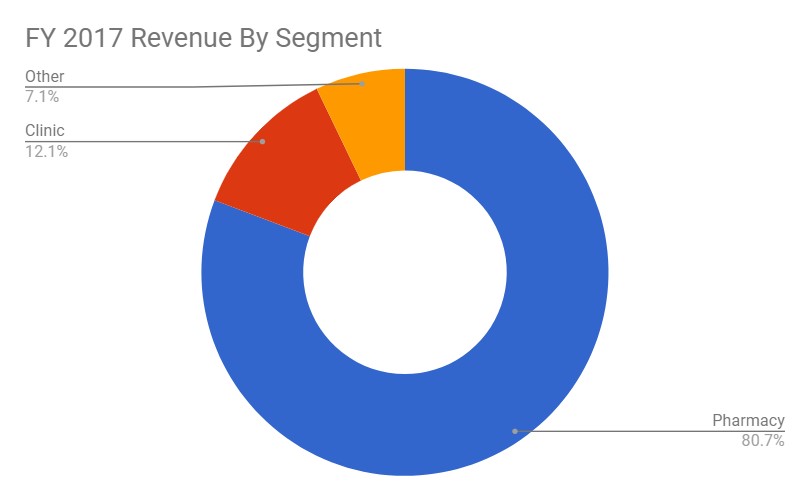
Source: Author calculation based on EM Systems filings
Long-time Value Investor’s Club (VIC) members may be familiar with EM Systems. The company was covered on two occasions: Once in 2015 and again in 2017. I highly recommend reading both before proceeding, as I am hoping to fill in the gaps rather than repeat the same information.
Industry
Since the Pharmacy segment accounts for 81% of EM System revenues, this section will mostly focus on the pharmacy industry in Japan.
According to MAC Advisory (Japanese), the pharmacy market in Japan was a 7.9 trillion yen ($74.2 B USD) market in 2016. The top 10 pharmacy operators (by prescription revenues) accounted for 15.8% of the industry. 70% of pharmacies were operated by individuals. There are approximately 58,000 pharmacies in Japan.
In November 2017, I briefly covered the convenience store, drug store and pharmacy industries. The post can be found here. With a heavier focus on pharmacies, the highlights are below:
- The three industries are merging/consolidating.
- There is an industry-wide shortage of pharmacists, which is expected to continue.
- Japanese government is pushing for “family pharmacist”, lower prices, and generic drugs.
Though it is tempting to look at Japan’s aging population and invest in pharmacies with a tailwind in mind, the Japanese government has a vested interest in reducing drug prices. With Japan’s universal health care system, all residents are required to participate in the public health insurance program. Participants shoulder a maximum out-of-pocket expense of 30% on government approved prescriptions.
The Japanese government reviews health care costs (including drug prices) every two years. Nursing care costs are reviewed every three years. Every six years, both reviews land on the same year, and 2018 is that year. Japan Times writer Tomoko Otake wrote about the highlights of this year’s health care review, effective April 1. In short, the Japanese government continued its efforts to incentivize neighborhood pharmacies, lower drug prices, and encourage generic drugs.
“Currently, if nonemergency patients go to hospitals without referrals, they are slapped with a surcharge of at least ¥5,000. With the revision this time, all hospitals with 400 beds or more will start charging such a fee, as opposed to those with 500 beds or more currently.”
Source: Japan Times
This may come as a surprise to some. In 2015, the Japanese government announced its plans to reduce the number of hospital beds by 10.5% by 2025. While this seems counter-intuitive at first, one of the main criticisms of the Japanese universal health care system is that it is too accessible:
“The country’s health system inadvertently promotes overutilization in several ways. For starters, there is evidence that physicians and hospitals compensate for reduced reimbursement rates by providing more services, which they can do because the fee-for-service system doesn’t limit the supply of care comprehensively. Japan’s physicians, for example, conduct almost three times as many consultations a year as their colleagues in other developed countries do”
Source: McKinsey & Co, emphasis added by author
As of July 2015, Japan had 1.331 million hospital beds. The government aims to bring this figure down to 1.191 million by 2025 (Japanese doc).
The government created five categories of hospital beds to better visualize its plans:
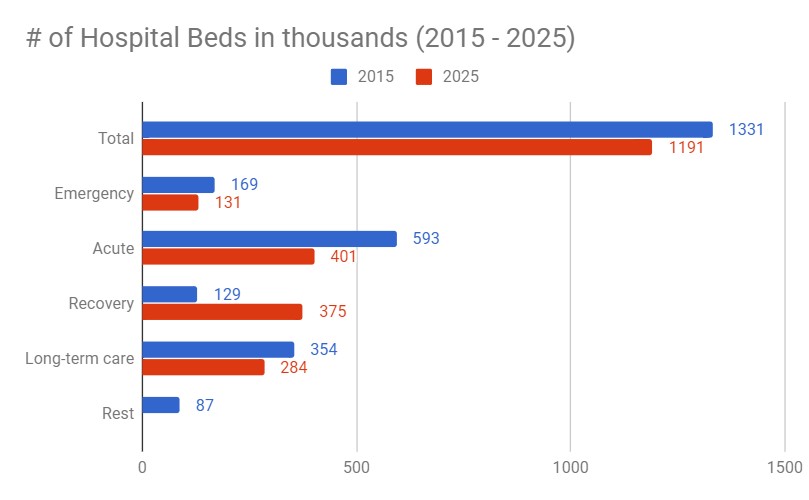
Source: Japan Cabinet Office data, chart created by author
Essentially, the Japanese government is trying to reduce unnecessary input for the healthcare system while increasing “patient turns” by tripling recovery beds. Much of the reduced long-term care and rest bed capacity will be taken care of through nursing homes and home care.
We can expect the number of clinics, the first line of defense for hospital input, to rise over the next several years. Neighborhood pharmacies fit right into Japan’s new community health care system, too.
Given the industry context, EM Systems’ recent focus on Electronic Health Record systems in its “Clinic” segment and Nursing Care systems are interesting. Eventually, the idea is to have all three of the systems working together.
There seems to be some discrepancies in EM Systems’ pharmacy software market share information. My calculation is based on EM Systems’ Recepty software install-base of 15,000+ (Japanese) divided by pharmacy store count of 58,000 (Japanese). This equates to 26% market share, which is the lowest figure I’ve seen on the internet, with 33% (as seen on the 2017 VIC writeup) being the highest. According to the 2017 VIC writeup, key competitors include subdivisions of Panasonic Healthcare and Mitsubishi Electric with market shares of 18% and 13%, respectively.
|
Segment |
Market Size
(facilities) |
Current Share | Target Share
(March 2019) |
| Pharmacy | 50,000 | 32% | 40% |
| Clinic | 10,000 | 2.50% | 10% |
| Nursing | 12,000 | 0.80% |
5% |
Source: Belletk (Analyst report in Japanese)
EM Systems
For a long time, pharmacy software was sold as a package, requiring significant upfront investment and a contract renewal every 5 years. Update distribution was a hassle. Often times, for mid to large size pharmacy chains, different versions of the same software were distributed, causing considerable heartache.
Launching its Application Service Provider (ASP) business model in 2008, EM Systems is a pioneer in pharmacy software. Today, the cost of EM Systems pharmacy software consists of an initial hardware and system purchase followed by a small standard monthly fee plus a fee per prescription after the 300th prescription in the month. The company uses a similar business model with its MRN medical system offering as well, but not for its Uni-medical offering.
According to the same Belletk report referenced earlier, 43.5% of Pharmacy segment revenues and 25.7% of Clinic segment revenues consisted of per transaction revenues in fiscal 2017. As system sales in both segments increase, per transaction revenues as a percentage of total segment revenues ought to grow. EM Systems’ reduced its standard monthly fee by 10%, lowering overhead for its customers and enticing potential customers to adopt EM System software.
EM Systems’ one-of-a-kind ASP model is already showing its strength, particularly with Pharmacy software, by generating strong free cash flow. In 2012, EM Systems marked its first free cash flow positive fiscal year since implementing the ASP model, generating a free cash flow margin of 6.6%. Since then, the company has nearly tripled its free cash flow. In fiscal 2017, the company generated a 12.9% free cash flow margin. The operating performance is steadily improving as well. In the two years following the ASP model implementation (fiscal 2009, 2010), EM Systems reported operating losses. In fiscal 2011, the company generated a 1% operating margin. In fiscal 2017, the company reported a 19% operating margin.
The more-than-healthy cash flow position has allowed EM Systems to clean up its balance sheet while opening up to small-scale M&A opportunities. At the end of fiscal 2009, EM Systems had about 7,700 million yen ($72.4 million USD) in debt and a debt-equity ratio of 1.28. Most of this debt was from buying land and building the company’s headquarters. Today, the company is effectively debt-free (net-cash balance sheet) with a debt-equity ratio of 0.06.
Management guidance and recent performance
In its medium term business plan, EM Systems management provided the following guidance.
| Actual | Management Guidance (May 2016) | |||
| (millions of yen) | FY2017 | FY2017 | FY2018 | FY2019 |
| Revenue | ¥13,676 | ¥13,900 | ¥14,470 | ¥14,670 |
| Operating Income | ¥2,597 | ¥2,050 | ¥2,170 | ¥2,280 |
| Net Income | ¥2,116 | ¥1,680 | ¥1,820 | ¥1,890 |
| By segment | ||||
| Pharmacy | ||||
| – Revenue | ¥11,122 | ¥10,990 | ¥11,340 | ¥11,390 |
| – Operating Income | ¥2,644 | ¥1,990 | ¥2,050 | ¥2,060 |
| Clinic | ||||
| – Revenue | ¥1,670 | ¥1,880 | ¥1,980 | ¥2,000 |
| – Operating Income | ¥17 | ¥5 | ¥30 | ¥100 |
| Other | ||||
| – Revenue | ¥982 | ¥1,120 | ¥1,250 | ¥1,370 |
| – Operating Income | -¥32 | ¥130 | ¥170 | ¥200 |
Source: Medium Term Business Plan (Japanese)
Though revenue lagged in fiscal 2017, operating income remained strong. In its fiscal 2017 report, management commented (Japanese) that new system sales did not meet expectations for all three segments. They also mentioned that, though Clinic segment revenues did not reach expectations, the segment reported its first profit because per transaction revenues fared well.
The Pharmacy segment continues to deliver strong operating performance. More importantly, however, the Clinic segment appears to have surpassed its break-even point. Comparatively, the Pharmacy segment is in a more mature phase. The Clinic segment is just getting started.
A couple things to note about Clinic segment growth. The Pharmacy segment ASP model transition laid out a lot of the ground work. EM Systems does not need to create a brand new distribution network from zero. Presumably, the years leading up to and immediately following the ASP model were nerve wrecking for EM Systems management. With no proven system or track record, the company proceeded to build its current, strong business model. As the company builds out the Clinic segment, it can leverage its track record as a successful pharmacy software provider.
In the first three quarters of fiscal 2018, the company already exceeded guidance for operating income, generating 2,315 million yen ($21.8 million USD) in operating income on 10,448 million yen ($98 million USD) in sales. That is 22% in operating margins. Part of the strong recent performance could be tied to companies rushing capital investment before the April 2018 health care review by the Japanese government. Put differently, the review essentially forces EM System customers to write down inventory, as drug prices are adjusted down. That said, management commented that system sales did not reach expectations, and also that its OEM supply business fared well.
Segment performance in first three quarters of fiscal 2018 are as follows:
| First 3Q of FY2018 | |
| Pharmacy | |
| – Revenue | ¥8,534 |
| – Operating Income | ¥2,184 |
| Medical | |
| – Revenue | ¥1,310 |
| – Operating Income | ¥129 |
| Other | |
| – Revenue | ¥724 |
| – Operating Income | -¥6 |
There is no question EM Systems will be hitting operating income target for fiscal 2018.
Valuation
It appears EM Systems has continually “missed” its internal new system sales targets, but has continually replaced the low/no margin initial installation revenues with high margin transaction revenues. One thing to keep in mind is that shrinking operating margins for the Pharmacy segment may be worrisome while the same may be a good thing for the Clinic segment. This is because the revenue mix of new system sales, monthly fees, transactional fees, maintenance, and OEM supply would be less concentrated on low margin new system sales as a segment matures. The Pharmacy segment is already relatively mature while Clinic segment is just getting started.
I believe a reasonable worst case scenario for EM Systems would be if the Pharmacy segment stopped growing. A reasonable multiple for a company like EM Systems (strong cash flow, operating margin, industry positioning) ought to be around 10 times EV/EBIT without any future growth taken into consideration.
The company is already well established in the pharmacy industry with strong market share, however, it is a newcomer in medical systems. The Clinic segment is passed its breakeven point with a 2.5% market share and already generating ~15% operating margins on a trailing twelve-month basis. With time, the operating margins ought to improve as the segment matures.
Based on March 14, 2018 closing price of 1,398 yen per share, EM Systems has a market capitalization of 49.6 billion yen ($466 million USD) and an enterprise value of 43.4 billion yen ($408 million USD). A 3,139 million yen ($29.5 million USD) trailing-twelve-month operating income currently gives the company a 13.8x EV/EBIT multiple.
Bad case
Assuming no growth in the Pharmacy or Other segment, 3% CAGR revenue growth and operating margin improvement (from 12% to 20%) in the Clinic segment, I estimate operating income to come in around 3,300 – 3,400 million yen ($31-32 million USD) for fiscal year end March 2021. Additionally, I estimate that EM Systems would accumulate cash at about 1,800 million per year (no dividend payouts) and clean up the trivial amount of debt it has, giving the company about 12,500 million yen in cash at fiscal year end March 2021. At 10x EV/EBIT, EM Systems’ share price would come in around 1,300 yen per share, a negative 2.5% investment CAGR. This is the bad case.
Good case
Assuming continued revenue growth at 6.4% CAGR (last 3 fiscal year revenue CAGR) for Pharmacy and Clinic segment, no change in Other segment, and margin improvement in Pharmacy (22% to 30%) and Clinic (12% to 24%), I estimate operating income to be around 4,600 – 4,700 million yen ($43-44 million USD) for fiscal year end March 2021. In this case, I estimate that EM Systems would accumulate cash at about 3,000 million yen ($28 million USD) per year (no dividend payouts) and clean up its trivial amount of debt. This would give the company about 16,000 million yen ($150 million USD) in cash at fiscal year end March 2021. At 10x EV/EBIT, EM Systems’ share price would be around 1,800 yen per share, a 8.8% investment CAGR. This is the good case.
The bottom line
EM Systems has a strong, hard-to-replicate business model which caters to an industry sensitive to regulation (i.e., pharmacies, prescriptions). The company is leveraging its strengths to extend its business model into other closely related industries (medical and nursing systems). At today’s 1,398 yen per share price, some of the growth is already priced in. I highly suggest keeping EM Systems on a watchlist. Investors can reasonably expect an investment CAGR between negative 2.5% and 8.8% over the next three years.
* JPY to USD conversion used (3/14/2018): 1 JPY = 0.0094 USD