NACCO (NC): The Stock Geoff Put 50% of His Portfolio Into
On October 2nd, Hamilton Beach Brands (HBB) was spun-off from NACCO Industries (NC). That morning I put about 50% of my portfolio into NACCO at an average cost per share of $32.50. Since that purchase was announced, several members of Focused Compounding have sent in emails asking for a write-up that explains why I made this purchase.
Unfortunately, there just isn’t much to say about my NACCO purchase. So, this write-up will be both brief and boring.
I bought NACCO, because the stock’s price after the Hamilton Beach spin-off seemed low relative to the earning power of the coal business.
All Value Comes from the Unconsolidated Mines
After the Hamilton Beach spin-off, the earning power of NACCO comes entirely from its “unconsolidated mines”. NACCO – through NACoal – owns 100% of the equity in these mines and receives 100% of the cash dividends they pay out (which is almost always equal to 100% of reported earnings). However, the liabilities of these mines are non-recourse to NACoal (and thus NACCO). Each mine’s customer (the power plant) is really supplying all the capital to operate the mine. This is why NACCO doesn’t consolidate the mines on its financial statements (because it isn’t the one risking its capital – the utility that owns the power plant is taking the risk).
You can see the financial statements for the unconsolidated mines here.
(It is very important that you click the above link and read through it carefully).
There Are Risks
NACCO also owns one consolidated mine (MLMC) which could potentially destroy value. And at the parent company level – so NACCO rather than NACoal – the company has legacy coal mining liabilities (“Bellaire”) and losses related to general corporate overhead.
NACCO’s customers are almost all “mine-mouth” coal power plants. They sit on top of coal deposits that NACCO mines and delivers to the plants to be used as fuel.
Coal power plants throughout the U.S. have been closing. The power plants NACCO supplies could close at any moment. And it would only take one such closure to seriously dent NACCO’s earning power.
NACCO’s largest customer accounts for probably 35% of the company’s earning power. NACCO’s two largest customers account for probably 50% of earning power. And NACCO’s three largest customers account for probably 65% of earning power.
NACCO’s Business Model
NACCO sells coal to its customers under long-term (most contracts expire in 13-28 years) supply agreements. The agreements are “cost-plus” and indexed to inflation.
Each Share of NACCO is Backed by 5 tons of Annual Coal Production
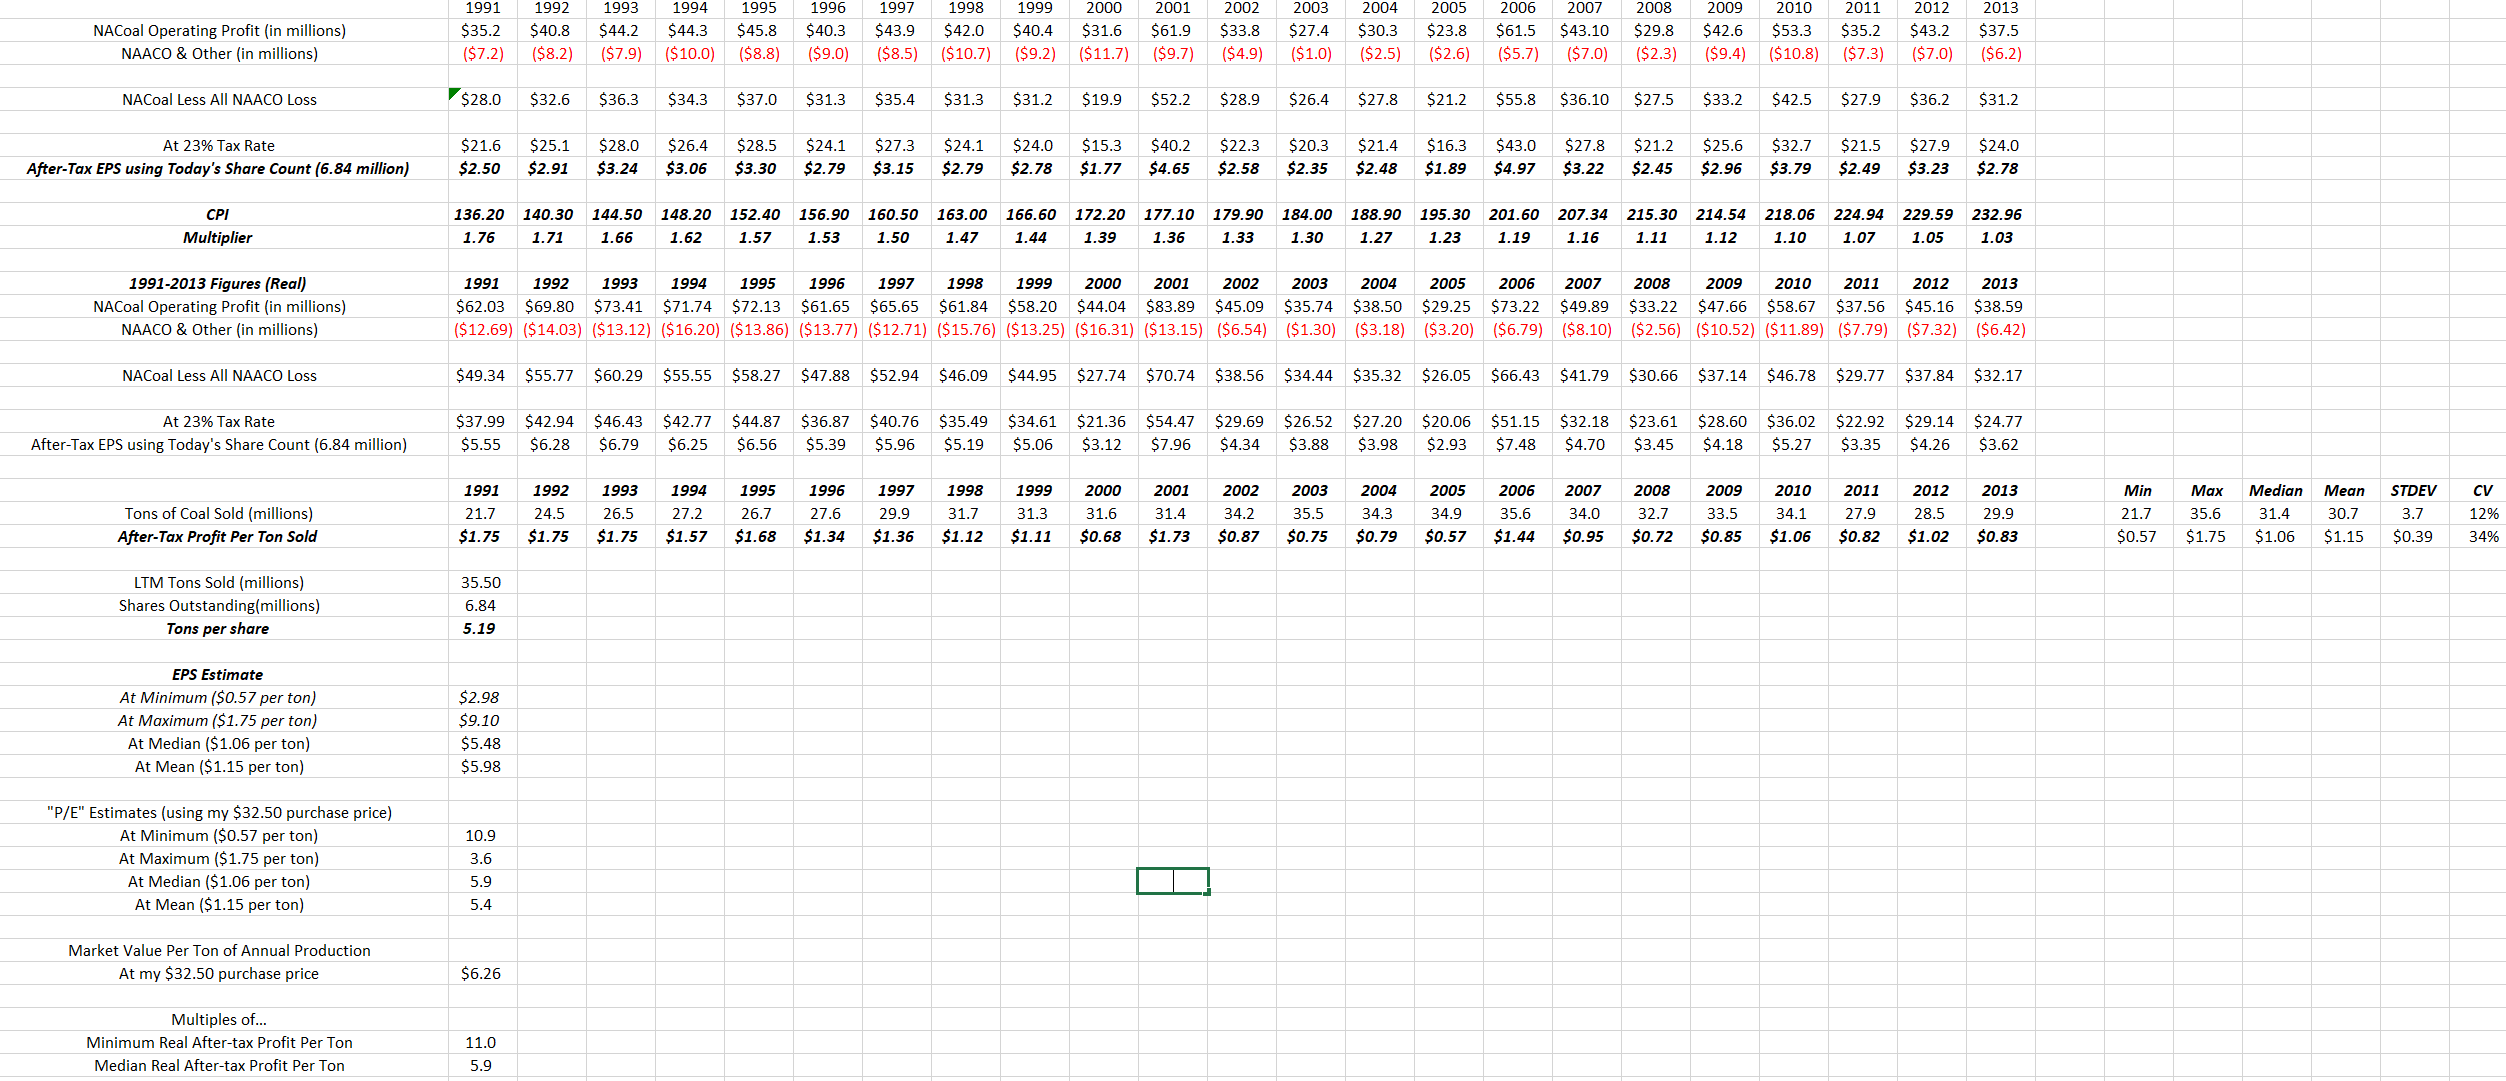
As you can see in this investor presentation, NACCO delivered 35.5 million tons of coal over the last twelve months. The company has 6.84 million shares outstanding, so each share of NACCO is now backed by 5.19 tons (35.5 million / 6.84 million = 5.19) of coal sold under a cost-plus contract indexed to inflation. I paid an average of $32.50 a share for my stake in NACCO. This means I paid about $6.26 ($32.50 / 5.19 tons = $6.26) per ton of annual coal production sold under these cost-plus contracts indexed to inflation.
How much is a ton of annual coal production worth at NACCO?
NACCO Makes Anywhere From 57 cents to $1.75 (After-Tax) Per Ton of Coal It Supplies
NACCO owned a couple consolidated mines (Centennial and Reed Minerals) that it wrote off. The various charges related to these mines muddied results for 2014, 2015, and 2016 so badly it seems best to just ignore these most recent years and rely only on the “clean” financials from years before 2014.
NACCO’s important mines have been supplying the same power plants under the same contracts for a long time. So, it makes sense to simply use long-term historical data for the years 1991-2013 instead of trying to re-state more recent results.
Because coal miners receive a tax benefit (“depletion”) as part of their day-to-day operations, it also makes sense to use estimated after-tax results instead of operating income. In its investor presentation, NACCO estimates it will pay a tax rate of 20% to 25% in the future. The company’s estimate is supported by the historical tax information for the unconsolidated mines (they file their returns as part of NACCO’s returns) which show those mines have paid taxes ranging from 21% to 27% a year and averaging 23%. In the estimates that follow, I have assumed NACCO will pay a 23% tax rate from now on.
NACCO operates under cost plus supply agreements indexed to inflation. So, the best way to estimate today’s earning power is to calculate the historical real after-tax profit per ton of coal supplied and then multiply that figure by the amount of coal being produced per share over the last 12 months (5.19 tons).
From 1991-2013, NACCO’s real after-tax profit per ton of coal supplied ranged from 57 cents (2005) to $1.75 (1991, 1992, and 1993). The median real after-tax profit per ton was $1.06. The arithmetic mean was $1.15. And the standard deviation in this series was 39 cents. Finally, the real after-tax profit per ton for the five most recent “clean” years was: $0.85 (2009), $1.06 (2010), $0.82 (2011), $1.02 (2012), and $0.83 (2013). The average after-tax real profit per ton of these last 5 years is 92 cents.
Using these real after-tax profit per ton figures, we can come up with a series of earnings “estimates” using current production of 5.19 tons per share.
At the minimum real profit per ton: $2.96/share ($0.57 * 5.19 = $2.96)
At the maximum real profit per ton: $9.08/share ($1.75 * 5.19 = $9.08)
At the median real profit per ton: $5.50/share ($1.06 * 5.19 = $5.50)
At the mean real profit per ton: $5.97/share ($1.15 * 5.19 = $5.97)
At the last 5-year mean real profit per ton: $4.77 ($0.92 * 5.19 = $4.77)
So, our estimate of earnings power would be somewhere in the range of $3 to $9 a share with a central tendency around $5.50 to $6 a share. If we use the last 5 years, we might put earning power at more like $4.75 a share.
At my average purchase price of $32.50 a share, the important figures are really the three more conservative “P/Es”. At the minimum real profit per ton we have a P/E of 11 ($32.50 / $2.96 = 10.98). At the median real profit per ton we have a P/E of 6 ($32.50 / $5.50 = 5.91). And if we use the average figure over the 5 more recent years of 2009-2013 we get a “P/E” of 7 ($32.50 / $4.77 = 6.81).
These estimates (which I created) made it appear that I was buying the stock at a high single digit P/E if I paid $32.50 a share. In other words, the estimates made it look certain that normal cash earnings for the “new” NACCO (free from Hamilton Beach and Kitchen Collection) would be greater than $3.25 a share.
I also checked the company’s figures. In the investor presentation, the graph showing “cash flow before financing” (essentially a measure of free cash flow) puts that figure at $41 million in 2015, $31 million in 2016, and $50 million over the last 12 months. With 6.84 million shares outstanding, that would give a per share free cash flow figure of between $4.53 ($31 million / 6.84 million shares = $4.53) and $7.31 ($50 million / 6.84 million shares = $7.31).
Also, you can now double check these earnings power estimates in a way I couldn’t before I bought the stock.
After I bought the stock, NACCO released pro-forma EPS for the first 6 months of 2017. The company shows the “new” NACCO earned $1.74 per share in the first 6 months of 2017. NACCO may earn less in the last 6 months of 2017 than it did in the first 6 months. However, it still appears to me from all these different approaches that NACCO’s earning power is not less than $3.25 a share. And I bought the stock at $32.50 a share. So, I did not pay more than a P/E of 10 for my shares.
Side Note: Amortization of Coal Supply Agreements
For the sake of simplicity, I haven’t discussed the fact that all these EPS numbers don’t “add back” a constant non-cash charge for the amortization of coal supply agreements. For example, when NACCO says it earned $1.74 pro-forma for the first 6 months of this year – you’ll notice it shows $1.2 million (18 cents a share) in “amortization of intangibles”. Basically, NACCO amortizes a little bit of its coal supply agreements with each ton of coal produced. In a normal year, I expect NACCO to have close to $3 million in amortization that will reduce reported earnings but not free cash flow. Overall, I expect NACCO – aside from the one consolidated mine (and that’s a huge caveat) – to produce very high free cash flow relative to reported earnings.
NACCO vs. NACoal
Also, when I made my calculations (which you’ll be able to see in a second if you squint real hard at an Excel sheet) I was conservative in how I calculated NACCO’s past earnings. NACCO is the name of the parent company. NACoal is the coal mining subsidiary. For all my calculations, I took just the operating profit from NACoal and then subtracted ALL of the operating loss from NACCO (the parent). Realistically, some corporate expenses have always been attributable to Hamilton Beach, Kitchen Collection, and Hyster-Yale (back before NACCO spun off that company). For the sake of conservatism, I always calculated the “new” NACCO’s historical after-tax earnings for a year as: (Operating Profit From NACoal – Operating Loss from NACCO) * 0.77. Basically, I took the coal mining business and allocated all corporate overhead to that business and then taxed the resulting profit at 23%.
(Note: The reality is a little more complicated than what I just said because NACCO – the parent – had been charging a management fee to its subsidiaries. However, this management fee was probably less than the actual corporate expenses the subsidiaries were responsible for. So, my general point still stands. If I erred in allocating corporate overhead, I erred on the side of overcharging NACCO’s coal mining operations.)
Quality of Earnings
It’s difficult to prove this, but I consider the quality of NACCO’s earnings to be high. There are several features of the company’s accounting that should cause reported EPS to be low relative to free cash flow. And then all of the earnings are tied to long-term cost-plus agreements that are indexed to inflation. Most other businesses with the same P/E as NACCO will convert less EPS into FCF and would struggle under inflation.
Risk of Catastrophic Loss
The big risk with NACCO is that it loses key customers as coal power plants in the U.S. shut down. Each mine is dependent on a nearby customer. The mine has no value once the power plant has shut down. The coal we are talking about here is lignite (“brown”) coal. It isn’t economical to ship. In the case of a coal power plant shutting down, I believe NACCO is in a better position to survive – albeit at a much lower earning power – the loss of its biggest customers than most public companies are. NACCO is organized so that the unconsolidated mines have debts which are non-recourse to NACoal and then NACoal has debts which are non-recourse to NACCO. When you buy shares of NC, you’re buying stock in the ultimate parent “NACCO”. Although NACCO’s earning power all comes from the unconsolidated mines (which are heavily indebted), those mines distribute 100% of their earnings in cash to NACoal each year. With the exception of its one consolidated mine (MLMC), NACCO won’t be stuck with “bad” coal mining assets of any kind. The company’s earnings come in the form of cash.
How I “Frame” NACCO
I think of each share of NACCO as an inflation adjusted stream of free cash flow. As I’ve shown, I think the stream has a “coupon” of greater than $3.25 and I bought it at $32.50. So, the yield is 10% or more and that’s effectively a “real” yield.
The average U.S. stock has a free cash flow yield in the 4% to 5% range and that yield is not as well protected against inflation.
It’s true that NACCO’s yield will eventually decline as coal power plants shut down (although, in recent years, the tons of coal supplied has risen rather than fallen). However, I think of my “margin of safety” as being the fact that it isn’t 100% certain these plants will shut down and they haven’t shut down yet. Till they do, cash will build up on the balance sheet of NACCO (the parent company) or it will pay out dividends, buy back stock, or acquire businesses unrelated to coal mining (as it did in the past).
Why I Don’t Recommend NACCO Shares
I put 50% of my portfolio into NACCO. But, I think people reading this should put 0% of their portfolio into NACCO. As long as electricity demand in the U.S. is declining and natural gas production is rising, coal power plants will shut down. As a shareholder of NACCO, you could wake up any morning to the news that the company has lost 35% of its earnings overnight. I don’t think this is a risk most investors can handle.
Therefore, I don’t recommend anyone invests in NACCO even though it’s now my biggest position.
Let me be clear: I’m not just saying this is a “perceived” risk you may want to avoid.
It’s a real risk.
NACCO is a risky stock.
I absolutely can’t prove that all of the power plants NACCO supplies won’t shut down real soon. This means I can’t prove NACCO won’t lose literally all of its business in the very near future.
End Note: Get Out Your Magnifying Glass
For those interested, here is a snapshot of an Excel sheet where I did some of the “earning power” calculations mentioned in this article.