Posts By: Andrew Kuhn

Andrew Kuhn September 26, 2019

Calculating Free Cash Flow: 5 Illustrated Examples From Actual 10-Ks

Some readers have emailed me with questions about exactly how to calculate free cash flow, including: Do you include changes in working capital? Do you really have to use SEC reports instead of finance websites?

Yes. You really do have to use EDGAR. Finance sites can’t parse a free cash flow statement the way a trained human like you can. As you know, I’m not a big believer in abstract theories. I think you learn by doing. By working on problems. By looking at examples.

Here are 5 examples of real cash flow statements taken from EDGAR.

We start with Carnival (NYSE:CCL).

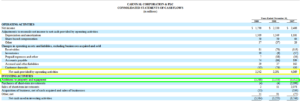
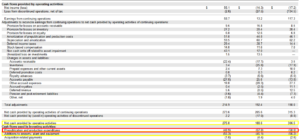
Notice the simplicity of this cash flow statement. It starts with “net income” (top of page) and then adjusts that number to get to the “net cash provided by operating activities” (yellow). To calculate free cash flow in this case you just take “net cash provided by operating activities” (yellow) and subtract “additions to property and equipment” (green). The result is free cash flow.

As you can see, Carnival produces very little free cash flow. Free cash flow is always lower than net income. That’s because cruise lines are asset heavy businesses like railroads. They have to spend a lot of cash to grow. Carnival’s reported earnings tend to overstate the amount of cash owners could actually withdraw from the business in any one year.

Carnival is our example of a “typical” cash flow statement. There’s really no such thing. But this one is simple in the sense that you only have to subtract one line “additions to property and equipment” from “net cash provided by operating activities” to get Carnival’s free cash flow.

Next up is Birner Dental Management Services (OTC:BDMS).

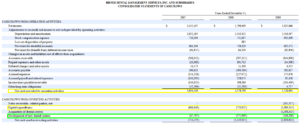
Notice how Birner separates capital spending into two lines called “capital expenditures” and “development of new dental centers”. This is unusual. And it is not required under GAAP (Generally Accepted Accounting Principles). However, it’s very helpful in figuring out maintenance capital spending. If you believe the existing dentist offices will maintain or grow revenues over the years, you only need to subtract the “capital expenditures” line from “net cash provided by operating activities.” But remember, any cash Birner uses to develop new dental centers is cash they can’t use to pay dividends and buy back stock.

Now for two cash flow statements from the same industry. Here’s McGraw-Hill (MHP) and Scholastic (NASDAQ:SCHL).

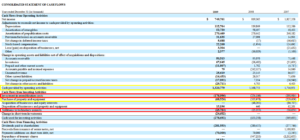
These are both publishers. And like most publishers they include a line called “prepublication and production expenditures” or “investment in prepublication cost”. Despite the fact that these expenses aren’t called “capital expenditures”, you absolutely must deduct them from operating cash flow to get your free cash flow number. In fact, these are really cash operating expenses.

For investors, this kind of spending isn’t discretionary at all. It’s part of the day-to-day business of publishing. I reduce operating cash flow by the amounts shown here. At the very least, …

Read more
Andrew Kuhn September 6, 2019

EBITDA and Gross Profits: Learn to Move Up the Income Statement

“In lieu of (earnings per share), Malone emphasized cash flow…and in the process, invented a new vocabulary…EBITDA in particular was a radically new concept, going further up the income statement than anyone had gone before to arrive at a pure definition of the cash generating ability of a business…”

  • William Thorndike, “The Outsiders”


“I think that, every time you (see) the word EBITDA you should substitute the word bullshit earnings.”

  • Charlie Munger


The acronym “EBITDA” stands for Earnings Before Interest, Taxes, Depreciation, and Amortization.

A company’s EPS (which is just net income divided by shares outstanding) is often referred to as its “bottom line”. Technically, EPS is not the bottom line. Comprehensive income is the bottom line. This may sound like a quibble on my part. But, let’s stop and think about it a second.

If EBITDA is “bullshit earnings” because it is earnings before:

  • Interest
  • Taxes
  • Depreciation and
  • Amortization

Then shouldn’t we call EPS “bullshit earnings”, because it is earnings before:

  • unrealized gains and losses on available for sale securities
  • unrealized currency gains and losses
  • and changes in the pension plan?

I think we should. I think both EBITDA and EPS are “bullshit earnings” when they are the only numbers reported to shareholders.

Of course, EPS and EBITDA are literally never the only numbers reported to shareholders. There is an entire income statement full of figures shown to investors each year.

Profit figures further down the income statement are always more complete – and therefore less “bullshit” – than profit figures further up the income statement.

So:

  • EBITDA is always less bullshit than gross profit.
  • EBIT is always less bullshit than EBITDA.
  • EPS is always less bullshit than EBIT.
  • And comprehensive income is always less bullshit than EPS.

Maybe this is why Warren Buffett uses Berkshire’s change in per share book value (which is basically comprehensive income per share) in place of Berkshire’s EPS (which is basically net income per share). Buffett wants to report the least bullshit – most complete – profit figure possible.

So, if profit figures further down the income statement are always more complete figures, why would an investor ever focus on a profit figure higher up the income statement (like EBITDA) instead of a profit figure further down the income statement (like net income)?


Senseless “Scatter”

At most companies, items further up the income statement are more stable than items further down the income statement.

I’ll use the results at Grainger (GWW) from 1991 through 2014 to illustrate this point. The measure of stability I am going to use is the “coefficient of variation” which is sometimes also called the “relative standard deviation” of each series. It’s just a measure of how scattered a group of points are around the central tendency of that group. Imagine one of those human shaped targets at a police precinct shooting range. A bullet hole that’s dead center in the chest would rate a 0.01. A bullet hole that …

Read more
Andrew Kuhn September 5, 2019

Why Are U.S. Banks More Profitable Than Banks in Other Countries?

By GEOFF GANNON
09/05/2019

A Focused Compounding member asked me this question:

“Have you any thoughts on why U.S. banks are so profitable (the better ones at least)? I’ve looked at banks in other countries (the U.K. and some of continental Europe) and banks there really struggle to earn the spreads and returns on equity of high quality U.S. banks. This is particularly strange as the U.S. banking market is actually pretty fragmented, certainly more so than the U.K. which is dominated by a few giant banks and has a pretty non competitive deposit market. But U.S. banks seem to earn far better returns.

I was discussing this recently with someone who is a consultant to banks advising them in regulatory capital (among other things) and he said that it was down to the regulatory capital requirements being looser in the U.S. I’m really not convinced by that explanation though.
Is this something you’ve thought about at all?”

I don’t know if the regulatory requirements are looser really. There’s one aspect of regulation nothing about outside the U.S.: fees. It may be that U.S. banks are better able to earn non-interest income on fees (not sufficient funds fees, charging monthly fees for accounts below a certain minimum, etc.) then banks in some countries, because there might be tougher consumer protection rules in some other countries. However, from what I know of U.S. regulatory rules as far as capital requirements versus banks in other countries – I don’t really agree. It’s not that common for me to feel a bank in another country is a lot safer than large U.S. banks. So, if it’s a regulation advantage. It doesn’t seem to be an advantage due to forcing banks in other countries to be too safe.

The U.S. has FDIC. I don’t know what programs in other countries are like. Obviously, the FDIC program in the U.S. – combined with some other rules – helps minimize rivalry for deposits. An unsafe bank shouldn’t be able to draw deposits away from a safe bank just by offering high interest rates on deposits. And depositors shouldn’t abandon a bank they like just because they learn it may be about to fail. Obviously, before the FDIC and other rules – those were concerns which could mean the weakest operators in the industry would lower profitability for the strongest operators through irrationally intense rivalry for deposits.

Negative rates are bad for banks. There could be cyclical reasons for why you are seeing poor results in parts of Europe, because of that.

However, I need to warn you that it’s NOT true that small U.S. banks are more profitable than banks in other countries. They aren’t. It’s ONLY banks with good economies of scale in the U.S. that even earn their cost of capital. My estimate when I looked at U.S. banks as a group is that since about World War Two, they haven’t earned their cost of capital and they have earned returns below the S&P …

Read more
Andrew Kuhn September 3, 2019

Why You Might Want to Stop Measuring Your Portfolio’s Performance Against the S&P; 500

By Geoff Gannon

December 8, 2017


Someone emailed me this question about tracking portfolio performance:

“All investors are comparing their portfolio performance with the S&P 500 or DAX (depends were they live). I have asked a value investor why he compared the S&P 500 performance with his portfolio performance…for me as a value investor it makes no sense. A value investor holds individual assets with each of them having a different risk…it’s like comparing apples and oranges.

The value investor told me that…Warren Buffett compares his performance with the S&P 500. But I believe he did it, because other investors…expect it or ask for such a comparison.

How do you measure your portfolio success? Do you calculate your average entry P/E and compare it with S&P500 or Dow P/E to show how much you (over)paid for your assets? Or do you avoid such a comparison and calculate only the NAV of your portfolio?”

I don’t discuss my portfolio performance on this blog.

And I think it’s generally a good idea not to track your portfolio performance versus a benchmark.

It’s certainly a bad idea to monitor your performance versus the S&P 500 on something as short as a year-by-year basis.

Why?

Well, simply monitoring something affects behavior. So, while you might think “what’s the harm in weighing myself twice a day – that’s not the same thing as going on a diet” – in reality, weighing yourself twice a day is a lot like going on a diet. If you really wanted to make decisions about how much to eat, how much to exercise, etc. completely independent of your weight – there’s only one way to do that: never weigh yourself. Once you weigh yourself, your decisions about eating and exercising and such will no longer be independent of your weight.

Knowing how much the S&P 500 has returned this quarter, this year, this decade, etc. is a curse. You aren’t investing in the S&P 500. So, tethering your expectations to the S&P 500 – both on the upside and on the downside – isn’t helpful. The incorrect assumption here is that the S&P 500 is a useful gauge of opportunity cost. It’s not.

Let me give you an example using my own performance. Because of when the 2008 financial crisis hit, we can conveniently break my investing career into two parts: 1999-2007 and 2009-2017.

Does knowing what the S&P 500 did from 1999-2007 and 2009-2017 help me or hurt me?

It hurts me. A lot.

Because – as a value investor – the opportunities for me to make money were actually very similar in 1999-2007 and 2009-2017. In both periods, I outperformed the S&P. However, my outperformance in 2009-2017 was small while my outperformance in 1999-2007 was big. In absolute terms, my annual returns were fairly similar for the period from 1999-2007 and 2009-2017. It is the performance of the S&P 500 that changed.

Many value investors have a goal to outperform the S&P 500. But, is …

Read more
Andrew Kuhn August 21, 2019

How Does Warren Buffett Apply His Margin of Safety?

March 26, 2011


Someone who reads the blog sent me this email.

Geoff,

In a previous email to me you explained how Warren Buffett values a company.  The text that your wrote was:

“He wants his investment to increase 15% in value. For every $1 of capital he lays out today he wants a day one return of 15 cents. That means a 15% free cash flow yield or buying a bank with an ROE of 15% at 1 times book or buying something for less than a 15% initial yield as long as it is growing.”

I understand that no problem whatsoever.  However, I am just curious.  How does he apply a margin of safety (for example 50%) to this fcf yield valuation?  Thanks for the help.

Chad

He doesn’t.

Buffett has said that with something like Union Street Railway – bought back in the 1950s – he saw the margin of safety was that it was selling for much, much less than its net cash. For Coca-Cola the margin of safety was the confidence he had in future drinking habits around the world.

Buffett felt sure people would drink Coca-Cola in larger and larger amounts per person per day in countries where Coke had been introduced more recently than in the United States. History was on his side. Per capita consumption of Coke had been rising everywhere for years. In contrast, history was not on the side of Union Street Railway.

Passengers – Union Street Railway

1946: 27,002,614

1947: 26,149,937

1948: 24,224,391

1949: 21,209,982

1950: 19,823,933

1951: 18,736,420

Bad trend.

But Union Street Railway had $73 in cash and investments – not a single penny of which was needed to run the actual business. The stock traded between $25 and $42 during 1951. So, even at its high for the year, Union Street Railway’s stock was trading for more than a 40% discount to its net cash.

At its low, the company’s cash covered its stock price almost 3 times.

Union Street Railway had a big margin of safety.

But so did Coke.

Buffett believed both Union Street Railway and Coca-Cola had an adequate margin of safety when he bought them.

With Coca-Cola it came from human drinking habits. With Union Street Railway it came from the cash and investments on the balance sheet.

Buffett was as confident in Coca-Cola as in Union Street Railway.

It’s just that his margin of safety in one case was people’s buying habits and in the other case it was the cash on the balance sheet.

Buffett doesn’t apply some standard 50% margin of safety to an intrinsic value estimate.

He just looks for situations where he’s confident his investment will earn an adequate return from day one far into the future.

And he wants to pay less than the stock is worth.

But that doesn’t mean it’s necessary to do an actual intrinsic value calculation and then slap on some percentage discount to that value.

It just means seeing the …

Read more
Andrew Kuhn August 20, 2019

The Moat Around Every Ad Agency is Client Retention

April 24, 2016

By Geoff Gannon

Moat is sometimes considered synonymous with “barrier to entry”. Economists like to talk about barriers to entry. Warren Buffett likes to talk about moat. When it comes to investing, “moat” is what matters. Barriers to entry may not matter. Thinking in terms of barriers to entry can frame the question the wrong way.

If you’re thinking about buying shares of Omnicom and holding those shares of stock forever – what matters? Do barriers to entry matter? Does it matter if it’s easy to create one new ad agency or a hundred new ad agencies? No. What matters is the damage any advertising company – whether it’s WPP, Publicis, or a firm that hasn’t been founded yet – can do to Omnicom’s business. How much damage can a new entrant do to Omnicom’s intrinsic value? How much damage can Publicis or WPP do to Omnicom? The answer is almost none. In that sense, the barriers to entry in the advertising industry are low but the moat around each agency is wide. How can that be?

First of all, the historical record is clear that among the global advertising giants we are talking about a stable oligopoly. The best measure of competitive position in the industry is to use relative market share. We simply take media billings – this is not the same as reported revenue – from each of the biggest ad companies and compare them to each other. If one company grows billings faster or slower than the other two – its competitive position has changed in relative terms. Between 2004 and 2014, Omnicom’s position relative to WPP and Publicis didn’t change. Nor did WPP’s relative to Publicis and Omnicom. Nor did Publicis’s position relative to WPP and Omnicom. Not only did they keep the same market share order 1) WPP, 2) Publicis, 3) Omnicom – which is rarer than you’d think over a 10-year span in many industries – they also had remarkably stable size relationships. In 2005, WPP had 45% of the trio’s total billings. In 2010, WPP had 45% of the trio’s combined billings. And in 2014, WPP had 44% of the trio’s combined billings. Likewise, Omnicom had 23% of the trio’s billings in 2005, 22% in 2010, and 23% in 2014. No other industries show as stable relative market shares among the 3 industry leaders as does advertising. Why is this?

Clients almost never leave their ad agency. Customer retention is remarkably close to 100%. New business wins are unimportant to success in any one year at a giant advertising company. The primary relationship for an advertising company is the relationship between a client and its creative agency. The world’s largest advertisers stay with the same advertising holding companies for decades. As part of our research into Omnicom, Quan looked at 97 relationships between marketers and their creative agencies.

I promise you the length of time each marketer has stayed with the same creative agency will surprise you. Let’s look …

Read more
Andrew Kuhn August 17, 2019

Insider Buying vs. Insider Incentives

December 17, 2017

by Geoff Gannon


A blog reader sent me this email:

Do you ever pay attention to insider transactions when analyzing a company?”

I do read through lists of insider buys from time-to-time. I follow a blog that covers these kind of transactions. But, I can’t think of any situation where I incorporated insider buying or selling into my analysis.


Learn How Executives are Compensated

I can, however, think of situations where a change in how insiders were compensated was included in my analysis. For example, years ago, I was looking at a stock called Copart (CPRT). It had a high enough return on capital and generated good enough cash flow that it was going to have more cash on hand than it could re-invest in the business pretty soon. Up to that point, it had been able to plow a lot of the operating cash flow back into expanding the business. However, it seemed like they had gotten too big to keep that up. So, they were going to have to buy back stock, pay a dividend, do an acquisition, or let cash pile up on the balance sheet.

I saw that the Chairman and the CEO (two different people, the CEO is the Chairman’s son-in-law) were now going to be compensated in a form that meant the share price a few years down the road is what mattered (if I remember right: compensation would now be a big block of five-year stock options combined with an elimination of essentially all other forms of compensation for those next 5 years). I had also read an interview with the Chairman (it was an old interview I think) where he didn’t strike me as the kind of person who was going to venture out beyond his circle of competence if and when he had too much cash.

So, I felt the likelihood of big stock buybacks happening soon was high.

To answer your question: no, I don’t really pay attention to insider buying and selling. But, yes, I do pay attention to whether insiders own a lot of stock, how they are compensated (what targets the company has for calculating bonuses), etc.

I can think of one situation where both the company and the CEO were buying a lot of stock at the same time. And, I should have bought that stock. If I had, I would’ve made a ton of money. However, to be honest, even if the CEO wasn’t buying shares and the company wasn’t buying back stock I should’ve seen this was a stock to bet big on.

It was trading for less than the parts would’ve fetched in sales to private owners. It was an obvious value investment. And that’s probably why insiders were buying.


Insiders Are Like You – Only Confident

Insiders tend to be value investors in their own companies. So, I think outside investors assume that insiders are acting more on inside information and less on

Read more
Andrew Kuhn August 13, 2019

Parks! America (PRKA): A Gem Trading at a 15% FCF Yield That Should Have 50%+ of Its Current Market Cap in Cash Within 5 Years

by ANDREW KUHN


Parks! America                                             

Price:    $0.14

Shares: 74.8m

MC:     $10.4m

Cash:    $3.2m

Debt:    $2.4m

EV:       $9.6m


Geoff and I use a checklist that we go through before investing in any company. Let’s go over it here before jumping into the actual business.


Boxes that need to be checked for us to invest:


  • Overlooked: Parks! America is an illiquid microcap. The stock currently has a market cap of only $10.4m, of which only about 4% of the shares turn over every year – the average daily volume is 12,806 – multiply this by 252 trading days a year and we get an average of 3.28m shares per year that trade – divide this by the 74.8m shares outstanding and we get a yearly share turnover of a little over 4%. In comparison, Facebook’s shares turn over 177% per year and Apple’s 148%. Parks! is overlooked.


  • High-Quality Business: We look for simple, predictable, free cash flow generative businesses. Parks fits this mold with solid EBIT margins and FCF generation. Their average FCF (EBITDA – Capex) margin since 2012 is 19% with a standard deviation of only 10% and a coefficient of variation of 0.49. This is a very stable business. I estimate that in 5 years the business will have more than half of its market cap in cash (assuming they continue to run the business like it is running currently).


  • The Stock CAGR Works Over time:

One of the first initial checklist items we do is look at a long-term stock chart to see how the business has performed over time. We want to roll with the tide.

Compound Annual Returns

YTD: -12%

1 Yr: -11.95%

2 Yr: +18%

3 Yr: +40%

4 Yr: 46%

5 Yr: 47%

6 Yr: 29%


  • Cheapness:

Current

P/E: 8x

EV/EBIT: 6x

FCF Yield: 15%


Parks! America is the perfect example of a stock that is overlooked and operates in a niche market. Since 1991, the business has owned and operated drive and walk through wild animal safaris. Combined, the company owns two parks – one in Pine Mountain, Georgia and the other in Stafford, Missouri. The Missouri park was acquired in 2008. Both parks are named Wild Animal Safari. Here are a few videos to get a visual tour from people who have vlogged the experience and uploaded it to YouTube:

https://www.youtube.com/results?search_query=wild+animal+safari+pine+mountain+ga+

Both parks combined have over 100 different species and over 900 animals. Together, the uniqueness of having a true animal safari in Georgia and Missouri with affordable admission prices makes Parks a business that people genuinely enjoy attending.

The trip advisor reviews for both parks are 4.5 stars with over 1,000 reviews.

Although people seem to love both parks equally, the economics of the two could not be more different. In 2018, the Georgia park did $5.1m in revenue with a 47% EBIT margin while the Missouri park only booked $923k with a -15.6% EBIT Margin. This is not anything new as the Missouri park has pretty much …

Read more
Andrew Kuhn August 13, 2019

Why I Don’t Use WACC

December 14, 2017

by Geoff Gannon


A blog reader emailed me this question about why I appraise stocks using a pure enterprise value approach – as if debt and equity had the same “cost of capital” – instead of using a Weighted Average Cost of Capital (WACC) approach:


“…debt and equity have different costs. In businesses with a (large) amount of the capital provided by debt at low rates, this would distort the business value. In essence I am asking why do you not determine the value of the business using a WACC, similar to how Professor Greenwald proposes in Value Investing: From Graham to Buffett and Beyond. The Earnings Power Value model seems theoretically correct, but of course determining WACC is complicated and subject to changes in the future. Nevertheless, your approach of capitalizing MSC at 5% is basically capitalizing the entire business value, including the amount financed by debt, at what is presumably your cost of equity for a business with MSC’s ROIC and growth characteristics. Perhaps I am coming at this from a different angle than you, but it seems a little inconsistent from the way I am thinking about it, and for businesses with more debt this would lead to bigger distortions. AutoNation would be a good example of a business with meaningful…debt that this approach would distort the valuation on.”


When I’m doing my appraisal of the stock – this is my judgment on what the stock is worth not whether or not I’d buy the stock knowing it’s worth this amount – I’m judging the business as a business rather than the business as a corporation with a certain capital allocator at the helm. Capital allocation makes a huge difference in the long-term returns of stocks. You can find proof of that by reading “The Outsiders”. Financial engineering makes a difference in the long-term returns of a stock. You can read any book about John Malone or Warren Buffett to see that point illustrated.


But, for me…


My appraisal of Berkshire Hathaway is my appraisal of the business independent of Warren Buffett. Now, knowing Warren Buffett controls Berkshire Hathaway would make me more likely to buy the stock and to hold the stock. So, it’s an investment consideration. But, it’s not an appraisal consideration for me. When I appraise Berkshire Hathaway, I appraise the businesses without considering who is allocating capital. Otherwise, I’d value Berkshire at one price today and a different price if Warren died tomorrow. I don’t think that’s a logical way to appraise an asset. Although I do think that buying an asset that’s managed by the right person is a good way to invest.


A good example of this is DreamWorks Animation (now part of Comcast). Quan and I valued DreamWorks Animation at a level that was sometimes more than double the stock’s price.


There was a point where we could have bought the stock at probably 45% of what we thought the business was

Read more
Andrew Kuhn August 9, 2019

All About Edge

December 23, 2017

by Geoff Gannon


Richard Beddard recently wrote a blog post about company strategy. And Nate Tobik recently wrote one about how you – as a stock picker – have no edge. I’d like you to read both those posts first. Then, come back here. Because I have something to say that combines these two ideas. It’ll be 3,000 words before our two storylines intersect, but I promise it’ll be worth it.


Stock Picking is Like Playing the Ponies – Only Better

Horse races use a pari-mutuel betting system. That is, a mutual betting system where the bets of all the gamblers are pooled, the odds adjust according to the bets these gamblers place, and the track takes a cut regardless of the outcome.

At the race track, a person placing a bet has a negative edge. He places a bet of $100. However, after the track takes its cut, it may be as if he now “owns” a bet of just $83.

At the stock exchange, a person placing a buy order has a positive edge. He places a bet of $100. However, after a year has passed, it may be as if he now “owns” a bet of $108.

All bets placed at a race track are generically negative edge bets. All buy orders placed at a stock exchange are generically positive edge bets.

In horse racing, the track generally has an edge over bettors. In stock picking, the buyer generally has an edge over the seller.


In the Long Run: The Buyers Win

The Kelly Criterion is a formula for maximizing the growth of your wealth over time. Any such formula works on three principles: 1) Never bet unless you have an edge, 2) The bigger your edge, the more you bet and 3) Don’t go broke.

In theory, the best way to grow your bankroll over time is to make the series of bets with the highest geometric mean. Math can prove the theory. But, only in theory. In practice, the best way to prove whether a system for growing your bankroll works over time is to back test the strategy. Pretend you made bets in the past you really didn’t. And see how your bankroll grows or shrinks as you move further and further into the back test’s future (which is, of course, still your past).

Try this with the two “genres” of stock bets:

1)      The 100% buy order genre

2)      And the 100% sell order genre

Okay. You’ve run multiple back tests. Now ask yourself…

Just how big was your best back test able to grow your bankroll over time by only placing buy orders – that is, never selling a stock. And just how long did it to take for your worst back test to go broke only placing buy orders.

Now compare this to back tests in the sell order genre.

Just how big was your best back test able to grow your

Read more
Skip to toolbar