Posts In: Geoff's Writeups

Geoff Gannon February 18, 2018

U.S. Lime (USLM): A High Longevity Stock in a Low Competition Industry

This is the second article in my new approach to writing for Focused Compounding each week. I will give you a look into my initial thoughts on a stock that I may then research further. At the end of this article, I will tell you my interest level (0% means there’s no chance I will follow-up with additional research on this stock; 100% means it’s already at the top of my research pipeline). This is my first article on U.S. Lime & Minerals (USLM). So, the question I have to answer here is not “should I buy the stock”, “what is the stock worth”, etc. Right now, the question is simply: should I research USLM further.

Charlie Munger is a fan of flipping how you frame a problem by “inverting”. If everyone is looking at a problem the same way – maybe looking at it upside down will give you a different but equally correct way of seeing things. Today, I’m going to “invert” the problem of finding a company with a high return on capital. Actually, what matters for us investors is a company’s incremental return on capital while we own it. What the stock earned on its capital before we invested in it and what it earns after we sell the stock isn’t what we care about. We care about the return on money put to work while we own the stock.

That’s a more difficult question to answer, though. So, let’s just start by asking if we think U.S. Lime will can earn an adequate unleveraged return on equity for a long-time into the future. Here, I am focusing on the “long-time into the future” part.

First, a confession. I personally don’t think in terms of return on equity when making my own investing decisions. Instead, I always “invert” ROE. I think of capital not as something you earn a return on but something which is a bit of a “tax” on growth. The reason I wrote about a stock like NIC (EGOV) is that if it does grow – that growth will have a very low owner’s equity tax. Maybe the stock will grow and maybe it won’t. But, if it does grow, it isn’t going to need to retain earnings to do it.

With a commodity like lime, it’s possible that the “inflation” part of any growth won’t require much capital investment. If you already own plenty of lime deposits, then it shouldn’t cost you much more to produce the same tons of lime each year – and yet, if the dollar gets 3% less valuable each year, you may be able to charge 3% more for your same quantity of lime produced.

This is the aspect of a commodity producer that’s attractive. There are other less attractive aspects to commodity producers that often make me shy away from them. But, maybe we’ll learn lime doesn’t share those qualities.

My interest in U.S. Lime is a little odd. On the one hand – as …

Read more
Geoff Gannon February 11, 2018

Babcock & Wilcox Enterprises (BW): A Risky Stock Getting Activist Attention

I’m trying something different this week. In an effort to share more ideas with members, I’ve decided I’ll write about whatever stock I’m looking at – even if I don’t like what I see. This will give you some insight into my stock selection process at the earliest stages. It will also let me give you more regular, stock-specific content. The downside, of course, is that it’s risky. I’m risking getting you interested in a stock you shouldn’t be interested in. So, I’ll rate the initial stock ideas I write up here with an interest level (from zero to ten) at the end of the article.

This week I’m writing about Babcock & Wilcox Enterprises (BW). I once owned this stock, because I bought the pre spin-off Babcock & Wilcox and kept my shares of BWX Technologies (BWXT) through to today. I sold my shares of Babcock & Wilcox Enterprises about 11 months ago at $15.48 a share.

Where is the stock today?

It’s at $5.80 a share.

Your first step in researching Babcock & Wilcox Enterprises should be to read the old report on Babcock & Wilcox in the “reports” section of this website. That report describes what would become BWXT and BW in great detail. I’m not going to spend time here discussing what it is that Babcock does, because you have a report available to you that describes that in greater detail than probably any public information on Babcock that’s out there.

However, that report describes what those businesses looked like as of about two and a half years ago.

Some things have changed since then with BW.

Let’s start with the recent news items that might get a value investor interested in the stock. The company has attracted two major investors.

One is Vintage Capital Management. It owns 14.9% of the company and now has two board seats. You can read Babcock’s announcement of the deal with Vintage here. You can also visit Vintage’s website for yourself and see what other companies are in their portfolio.

The second – and more recent – investor in Babcock is one you’re more likely to have heard of: Steel Partners.

The details I’m going to give you now come from Steel Partners’ 13D on Babcock filed February 5th. Steel Partners owns 11.8% of Babcock & Wilcox shares. These shares were bought between January 26th and February 5th at prices between $5.99 and $6.58. The stock now trades at $5.80. So, you can get your shares a bit cheaper than Steel Partners got their shares. That’s one reason for writing this up obviously.

Another reason is that the stock trades at $5.80 a share and Steel Partners apparently wanted to buy all of Babcock for $6 a share. This quote is from the 13D:

On December 15, 2017, Steel Holdings made a proposal to the Issuer to acquire all of the Shares not owned by Steel Holdings or its subsidiaries for $6.00

Read more
Geoff Gannon February 1, 2018

NIC (EGOV): Loses Its Biggest Customer (Texas) – Stock Drops 20% Instantly

As I write this, NIC (EGOV) stock is down 20% for the day. For potential buyers of the stock, there have been two developments in the last 24 hours. One, EGOV announced it lost the Texas dot org portal. It is still in the running for payment processing on behalf of the state. Texas, as a whole, accounted for 20% of EGOV’s revenue. It may have accounted for even more than 20% of the company’s profits. Two, shares of EGOV are now down 20% in price. EGOV has no debt and has some net cash. So, a 20% decline in the stock price is equivalent to a 20% re-pricing of the entire business’s value. Right now, I can’t say that one of these events is clearly outsized versus the other. So, I can’t say that the news of the last day should make you much more or much less inclined to buy the stock. That’s because the loss of Texas is a big loss for the business. However, we already knew: 1) That any business EGOV has could be lost and 2) That any re-bid for something like Texas could be done at a lower level. So, the expected probability of losing Texas wasn’t 0% before yesterday. And yet the stock dropped by almost 20% when the company announced it has lost revenue of about 20% of the total company. You see how the similar scale of the two items – the loss of a profitable business and the reduction in the stock’s price – make it difficult to say whether the stock has become a lot more or a lot less attractive.

So, I would caution those who say this clearly is a buying opportunity or this clearly is the moment to bail out on the stock – right now, I don’t see this moment being either of those things.

What do I see?

There were some other points discussed in the earnings release and the earnings call transcript. You can read the full transcript at Seeking Alpha.

  1. Same-state revenue growth in interactive government services continues to be excellent and management continues to expect it to keep being excellent. Interactive government services – these exclude driver history records – were up 11% for all of 2017. As discussed a little in the article I wrote on EGOV and even more in the comments to that article, a fast rate of growth in same-state interactive government services means EGOV will be less reliant on car related revenue and may even be able to grow its overall business even if it can’t win more state contracts and keeps losing some contracts.
  2. The information (really “guidance”) provided on taxes was also excellent. In 2018, the company expects its tax rate – “before any discrete items” – to be in the range of 24% to 25%. Historically, EGOV’s tax rate had been in the high 30s. It was between 35% and 40% in something like 13 of the last 15 years. So,
Read more
Geoff Gannon January 21, 2018

Carrols Restaurant Group (TAST): America’s Biggest Burger King Franchisee Comes with “Rights of First Refusal”

Guest write-up by Vetle Forsland


Overview


Carrols Restaurant Group (TAST) is the largest Burger King franchisee in the US. They are currently operating 753 Burger King restaurants on the east coast of North America, in 16 different states. That accounts for about 10.2 % of all Burger King locations in the USA.


Carrols was founded in 1960. At the time, they were operating an independent burger chain. In 1976, they started converting those stores to Burger King locations, and they became a franchisee. In the 1990s they were already one of the nation’s largest Burger King franchisees. Later, Carrols bought the Pollo Tropical and Taco Cabana brands, which accounted for about 50 % of the company’s revenue in the 2000s. In 2012, Carrols spun off the two latter businesses to Fiesta Restaurant Group, and Fiesta’s market cap is currently around $520 million vs Carrols’ $450 million. The spin-off took place shortly after 3G capital took control of Burger King’s owner, Restaurant Brands International (QSR). A part of 3G’s plan was to give more power to franchisees, as these businesses in the past were capped to a certain amount of Burger King locations, leaving BK restaurants fragmented and underperforming, as a result of little to no economies of scale.


Since the spin-off, Carrols has put significantly more focus on expanding their business and acquiring other Burger King locations. Most notably, they acquired 278 restaurants from QSR in 2012. Sales have increased 23 % annually on average since the spin-off, versus a 1 % decrease a year from 2000-2011. Additionally, the number of restaurants has increased around 24 % since 2012, compared to a 1.4 % decrease in locations in the 11-year period before the spin-off (Carrols had an IPO in 2004, so store counts before 2000 are non-existent/very difficult to find).


The 2012 acquisition of nearly 300 restaurants from QSR was financed through debt and preferred stock issued to QSR. So, Burger King’s owner basically bought a 21 % equity stake in Carrols. Executive officers and directors also own 5 % of the company, so 26 % of Carrols is owned by insiders. The 2012 deal included a preapproval by Burger King for Carrols to expand to 1,000 restaurants in “Rights of First Refusal” states, and the ability to expand beyond this region with Burger King’s approval. Carrols therefore has Rights of First Refusal in 20 states on the East Coast, paving the way for more acquisitions in the near future. 21 % of Carrols’ restaurants today are in North Carolina, 17 % of them are in New York, and 31 % are in Indiana, Ohio and Michigan. So, 69 % of their restaurants are in 5 states, diversifying their revenue but at the same time making the company vulnerable to potential economic downtrends on the east coast.


Durability


Restaurants have been around for hundreds of years, and serves as an important part of modern culture and our society today. There is no need to analyze …

Read more
Geoff Gannon January 15, 2018

Dunkin’ Brands (DNKN): A 100% Franchised Business Built on a “Morning Ritual”

Guest Write-up by Jayden Preston


Overview

Dunkin’ Brands owns two well-known quick service restaurant (QSR) brands, i.e. Dunkin’ Donuts that sell coffee and baked goods, and Baskin Robbins, selling hard serve ice cream. Dunkin’ Brands is now purely a brand owner, as they currently employ a 100% franchised business model, with over 20,000 points of distribution in more than 60 countries worldwide.


They organize their business into four segments: Dunkin’ Donuts U.S. (DDUS), Dunkin’ Donuts International (DDI), Baskin-Robbins International (BRI) and Baskin-Robbins U.S. (BRUS)


Dunkin’ Donuts is the more important brand to the business. Despite the term “Donuts”, it has moved away from its root to become a major coffee beverage house in the US. It is a national QSR leader in serving coffee, selling more than 1.9 billion cups of hot and iced coffee and espresso-based beverages per year. For 11 straight years, Dunkin’ Donuts has been named the top brand for customer loyalty in the out-of-home coffee category in the US. In FY2016, systemwide sales of DDUS was $8.6 billion, with 58% coming from coffee and other beverages. The brand is even considering shortening its name to Dunkin’. For Dunkin’ Brands, their Dunkin’ Donuts segments generated revenues of $630.9 million, or 79% of total segment revenues in FY2016. Dunkin’ Donut’s brand equity is much stronger in the US, generating $608.0 million in revenue, while the international segment only had $22.9 million in revenue.


The situation reverses for Baskin-Robbins. Its international segment generated revenues of $119.0 million, while the US segment produced $47.5 million. The brand develops and sells a range of frozen ice cream treats such as cones, cakes, sundaes, and frozen beverages. The brand is highly recognizable in the US, where it enjoys 89% aided brand awareness in the US and internationally in South Korea, Japan and the Middle East.


As of December 31, 2016, there were 12,258 Dunkin’ Donuts points of distribution, of which 8,828 were in the U.S. and 3,430 were international, and 7,822 Baskin-Robbins points of distribution, of which 5,284 were international and 2,538 were in the U.S.


Franchising Agreements


Let’s talk first about their franchising agreements.


A franchisor usually has several means to make their franchisees “captive”: 1) Royalties as a percentage of gross sales, 2) Rental payments on properties, 3) Required purchases from a company-owned supply chain and 4) Marketing fund pay-ins.


As with many franchisors, the majority of the Dunkin’ Brand’s revenue comes from royalty income, usually set as a percentage of gross sales made by franchisees, and other franchisee fees, including initial franchisee fee in the US. This is an upfront payment for the right to operate one or more franchised brands from Dunkin’ Brands.


The effective royalty rates for the different segments are 5.5% (DDUS), 4.8% (BRUS), 2.4% (DDI) and 0.5% (BRI). The much lower royalty rates for BRI reflects a difference in business model for that segment. Dunkin’ Brands derives revenue from the sale of ice cream …

Read more
Geoff Gannon January 15, 2018

NIC (EGOV): A Far Above Average Business at an Utterly Average Price

NIC (EGOV) is a company that’s – as the ticker suggests – focused on eGovernment. In particular, NIC is focused on providing internet based interactions with state governments in the United States.

This is not a truly huge market. EGOV is by far the market leader and yet it only has $331 million in revenue, $78 million in pre-tax profit, and $59 million in after-tax free cash flow. The company is valued at $1 billion (the market cap is greater, but the company has net cash). To put this in perspective, EGOV has about half the addressable market for state government portals in the U.S. So, the stock market is saying that the entire potential state government portal industry – for all 50 states – is worth no more than $2 billion.

To me, that sounds a lot like a niche. And that’s what got me interested in EGOV. Actually, my co-founder, Andrew, got me interested in EGOV. But, I think my interest in the stock quickly outstripped his own.

In the U.S., government clients can be broken down into: 1) school districts, 2) cities / towns / municipalities, 3) counties, 4) states, and 5) the federal government (including military branches and various agencies). The biggest available government contracts are at the federal level. And the greatest number of available contracts are at the local level.  For example, a Department of Defense contract would be a deal serving just one client, but the client would be very big. The Department of Defense has an annual budget of $534 billion. Meanwhile, the largest state government in the U.S. (California) only has an annual budget of $183 billion. Keep in mind, the median U.S. state by population (Louisiana) is about one-eighth the size of California. So, the average state’s budget might be 5% of the Department of Defense’s budget.

The biggest state with which NIC does business is Texas. It is the second most populous state in the U.S. (behind California) and yet we know that the revenues from providing eGovernment services through the Texas.org portal are only about $64 million a year (EGOV’s 10-K tells us that Texas is 20% of NIC’s total revenues and NIC’s total revenues were $318 million last year).

It may seem like I’m throwing a lot of numbers about market size at you here for no reason. But, I think there’s a very important reason that goes to the core of whether you should or shouldn’t invest in EGOV.

How niche is this business?

How competitive is this “industry” now?

And how competitive is it likely to get?

My guess – as long as EGOV stays in its niche of providing individual online portals for the 50 U.S. states – is that isn’t not very competitive now and it’s not likely to get much more competitive in the future. However, if EGOV strays from operating “dot gov” sites for the states into trying to win business with federal agencies, city governments, etc. (which it is already …

Read more
Geoff Gannon December 24, 2017

Cars.com (CARS): A Cheap Enough Stock with a Clear Catalyst and Tons of Rivals

About a week ago, Starboard Value disclosed a 9.9% position in Cars.com (CARS). Starboard Value is an activist hedge fund. It is probably best known for its 294-page presentation on Darden Restaurants (DRI) back in 2014. You can read that presentation here (PDF). Cars.com is a 2017 spin-off from Tegna (TGNA). Tegna is the rump of the old Gannett. It consists mostly of local TV stations. The public company now called Gannett (GCI) was spun-off from Tegna (then known as Gannett) in 2016. It consists mostly of USA Today (a national newspaper in the U.S.) and about 100 local newspapers.

So, in a sense, the public company Cars.com was formed as a break-up of a break-up.

Cars.com is a research website for car shoppers. Publicly traded competitors include CarGurus (CARG) and TrueCar (TRUE). TrueCar went public in 2015. You can read its IPO prospectus here. CarGurus went public in October of this year. You can read its IPO prospectus here. Because Cars.com was a spin-off instead of an IPO, the SEC document it filed is different. You can read Cars.com’s 2017 spinoff document (its S-1) here. The company has yet to file a 10-K. You can read the most recent 10-Q here.

I’m not going to describe what Cars.com does, because you can visit the website or download the app (today, most people use the app) and play the role of customer for yourself. No description I can give you will explain the company better than having you just give the website a whirl.

So, I’m not going to explain Cars.com’s business. What am I going to do?

I’m going to explain why I’m writing to you about the stock.

I’m writing to you about Cars.com stock for 3 reasons:

  1. An activist hedge fund, Starboard Value, now owns just under 10% of the company
  2. The stock’s history is that Cars.com was bought by Gannett (then a TV and newspaper company) in 2014 and then Gannett broke into two parts in 2016 (Cars.com went with the TV part) and finally Cars.com was broken off of an already broken-off company. So, there are no long-time owners/analysts/etc. of Cars.com stock and many of the investors who have held the company’s – or its predecessor’s – shares were not originally interested in owning a website.
  3. Some competitors of Cars.com trade at much higher multiples of sales, earnings, etc. than Cars.com does.

In other words: this is a Joel Greenblatt “You Can Be a Stock Market Genius” type situation. The company is the end result of a fairly recent (2014) acquisition and two very recent (2016 and 2017) spin-offs. Most importantly, the stock appears to be a relative value.

Is it a good business?


Quality

The business model is theoretically a good one. And the company’s current financial results are very solid. A website like this has economics similar to a local TV station. For full-year 2017, management is guiding for an adjusted …

Read more
Geoff Gannon December 8, 2017

The Cheesecake Factory (CAKE): A Second Opinion

Guest write-up by Vetle Forsland


Introduction


The Cheesecake Factory operates 208 restaurants primarily in the US. Of these locations, 194 of them are The Cheesecake Factory-restaurants, 13 are under the Grand Lux Café-brand, and one under the RockSugar Southeast Asian Kitchen mark. Additionally, they have 15 Cheesecake-branded restaurants in other parts of the world. These are all upscale casual dining restaurants. The customer eats freshly prepared food in the restaurant while a waiter provides table service. On average, a check from their restaurants was $21 (per person) in 2015, and $20.20 in 2016. The overwhelming majority (91 %) of the company’s sales comes from The Cheesecake Factory chain. The Cheesecake Factory restaurants offer high-quality food at moderate prices, with more than 200 items on their menu including 50 or so cheesecakes. It is known for its ginormous portion sizes and high-calorie dishes. Their core menu offerings include appetizers, pizza, seafood, steaks, chicken, burgers, pastas, salads and sandwiches, and they review and update their menu twice a year. The locations are large, open dining areas with a modern design. This means that Cheesecake Factory locations require higher investment per square foot than typical casual dining restaurants – but Cheesecake also has higher sales per square foot than competitors.


The Cheesecake Factory originated in 1972, when a small bakery opened in Los Angeles by Evelyn Overton. In 1978, her son, David Overton (who is still CEO of the company) opened the very first Cheesecake Factory restaurant. It was a huge success, with long lines on opening day. Overton quickly expanded the concept to other parts of the country, and in 1992, the company was incorporated as The Cheesecake Factory Incorporated in Delaware. Since 1997, Cheesecake has opened 11 restaurants a year, meaning an annual restaurant count growth of 15.8 % (7.4 % for the past 10 years). Management believes there is room for 300 Cheesecake restaurants in the US. Basically, this means that they will be able to open ~7-10 restaurants of their crown jewel a year for the next 10-15 years. In addition to this, the company is pursuing several incremental growth opportunities.


The stock price has fallen from a 52-week high of $67/share to $45/share (after dipping to $38 earlier this fall). This dramatic sell-off is most likely caused by declining same-stores sales. In May, Cheesecake reported a like-for-like growth of 0.3 %, and a -2.3 % decline in traffic. Restaurant chains often go through years of consecutive growth in same stores sales, with periods of consecutive quarters of declining same stores sales in between. So this is not very unusual in this business. The company also reported a decline of 0.5 % in Q2, which caused further sell-offs. Cheesecake stock has fallen about 35 % since the Q1 announcement. Furthermore, they are currently forecasting comparable sales decline of about 1 % for the full fiscal year.


Durability


The restaurant industry is a very durable industry. The demand for eating out is consistent in the US, and …

Read more
Geoff Gannon December 6, 2017

The Cheesecake Factory (CAKE)

 Guest write-up by Jayden Preston


Fellow Focused Compounding member Kevin Wilde has written two posts on The Cheesecake Factory (over at the “Idea Exchange”). I suggest you read his posts first to get a better glimpse at the company’s financials. This article is intended to be a more qualitative one.


Overview


Originated in 1972, the predecessor of The Cheesecake Factory was a bakery operation founded by the parents of Chairman David Overton in Los Angeles. In 1978, David Overton led the creation and operation of the first The Cheesecake Factory restaurant in Beverly Hills, California. This essentially led to the inception of the upscale casual dining segment in the US.


Fast forward nearly 40 years, The Cheesecake Factory now operates 209 Company-owned restaurants, comprised of 195 restaurants under The Cheesecake Factory brand name; 13 restaurants under the Grand Lux Café mark and one restaurant under the Rock Sugar Pan Asian Kitchen name. Internationally, 18 The Cheesecake Factory restaurants are operated through licensing agreements by their partners overseas. The Company also has a baking segment, running two bakery production facilities in the US. All the cheesecakes served in their restaurants, including international licensees and third party bakery customers, are made at either of these two facilities.


Operating in the upscale casual dining segment, their average check per customer, including beverages and desserts, is above $20 per customer.


In Nov 2016, they have also invested $42 million for minority stakes in two concepts, North Italia and Flower Child, and will provide growth capital for them going forward.


As restaurants bearing The Cheesecake Factory brand still delivers most of the value in this company, we will focus our following analysis on them.


Major Differentiation Points


Their restaurants are different from most restaurant chains in the following ways:


  1. Except their desserts being produced at their bakery facilities, substantially all other menu items are prepared from scratch locally at their restaurants, with fresh ingredients.
  2. Their restaurants are huge with size ranging from 8,000 square feet to 12,000 square feet.
  3. The capital investment per square foot for each of their restaurant is thus higher than most, even in the casual dining industry. It usually costs $8 million or more to set up one new restaurant.
  4. Offsetting point number 3 is the unusually high sales per square foot generated in their restaurants. Particularly, the average The Cheesecake Factory restaurant generates above $10 million in sales per year, averaging close to $1,000 in sales per productive square feet.
  5. Extensive menu covering a huge variety of dishes, appealing to a diverse customer base across a broad demographic range. The Cheesecake Factory menu features more than 200 dishes. The menu is updated twice every year.
  6. Higher percentage of sales from desserts than average. Dessert sales was 16% of revenue in FY2016.


Durability


The business of restaurants is durable as long as humans exist, because I believe eating out will never go extinct. Instead, a …

Read more
Geoff Gannon November 29, 2017

Zooplus

Zooplus

Guest write-up by Vetle Forsland


Introduction


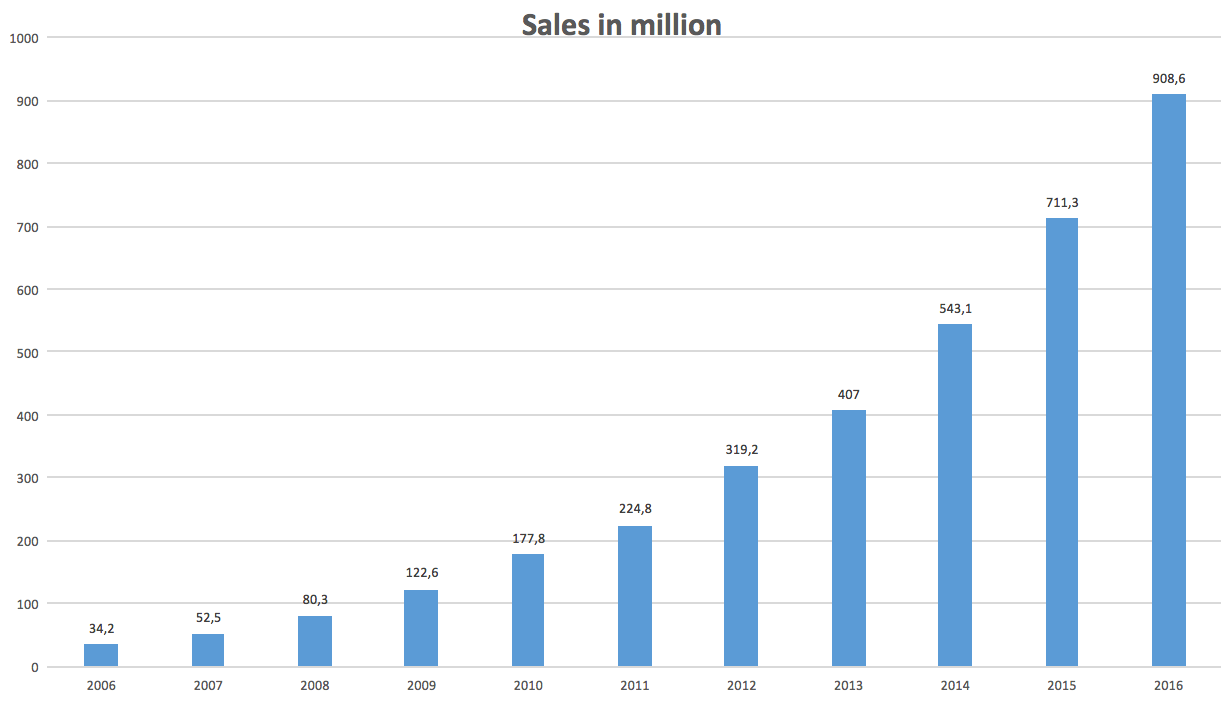
Zooplus is the leading online pet food retailer in Europe. It has on average grown sales 38% annually since 2006 (IPO in 2008) and annualized sales growth since 2010 is a 31%. In 2016 sales grew by 28%, to 908 million EUR, and there is room for additional expansion. Generally, the retailer with lowest prices and best customer service will come out as the industry leader. I believe this will be Zooplus. Lower prices and good customer service will lead to a high customer retention rate, the latter being at 92 % today. At the same time, this is a company with a lot of room for future growth, good financials and no debt.

Since its foundation, Zooplus has grown to become the clear leader in online pet supplies in Europe. The company also ranks number 3 in the overall European market for pet supplies after Fressnapf and Pets at Home. As Zooplus grows, it will become more cost efficient through economies of scale. More revenue will justify building distributing centers, which will bring the depressed margins today upwards, and create a good profit for shareholders.


Zooplus was formed in 1999, and has been operating in the pet market for more than 17 years, and on the way launched their business model in 30 countries. Pet supplies is a big segment of the European retail industry. In 2016, gross sales of pet supplies added up to around 26 billion EUR. Because of higher populations and more pets in the majority of countries, I expect this figure to continue growing over the years. Furthermore, Europe is expected to see considerable growth in online retailing, which will propel Zooplus’ sales momentum.


Pet supplies is not a cyclical industry. Sure, people will try to avoid high-end pet food brands in economic downtrends – but unless they want Kitty to starve, pet food will forever be in high demand. I believe Zooplus is in a good position to make money from these facts.


Online groceries have not lived up to the potential they once were estimated to have, so why do I think customers will shift to online pet supplies in the future? (only 6.8% of pet supplies are sold online). First of all, our beloved pets need food just as much as we do. As pet food has a (very) long expiration period, pet owners will want to buy it in bulks for lower prices – to make sure they’re never out of food for the little ones. That’s how my parents (and I) buy pet food in Norway. However, in brick and mortar stores, it is problematic for customers to buy in large bulks, since they actually have to carry the bags from the store and home. Additionally, Europeans live in dense and urban areas, where public transportation/walking is more common, making it even more difficult to buy pet food in bigger bulks.


The online pet food segment has solved this …

Read more
Skip to toolbar