Geoff Gannon June 17, 2018

There’s Always a Simpler Problem to Solve


To Focused Compounding members:
As a stock picker, when you’re first faced with the decision to buy or not buy a stock – it seems like a complicated question. Consider the mental math problem of 54 times 7. There are a couple ways of tackling this problem. The simplest though is to multiply 50 by 7, getting 350 and then multiply 4 by 7 getting 28. You add 350 to 28 and get 378. There are several ways of solving this problem. However, in actual practice, the method I laid out is the best. Sure, the answer is exactly the same as if you first multiplied 7 by 4 getting 28 to start. However, if your brain hits a snag while keeping track of the problem you’re solving you would, in the first case, already have the number 350 and therefore be just 7.5% below your target even if you gave up right then. Using the second method, your first step would only get you to the number 28. You’d be 92.5% below your target at that point and the only other bit of information you’d have is that the answer “ends in 8”. Knowing an answer ends in 8 might be useful on a math multiple choice test – but not much else. However, being just 7.5% shy of of an answer – and knowing you’re below the answer, not above – is often helpful in real life. The step “50 times 7” is simple and informative. The step “4 times 7” is just as simple, but far less informative. When analyzing something, the step you want to take next is the one that maximizes both the simplicity of the step and the value of the information you get by performing that step.

I said “…the only other bit of information you have…” back there. And that might be a helpful way to think of solving stock analysis problems: as taking steps that get you “bits” of information. What bit of information is most valuable to me? At the end of the day, a stock picker needs to decide only two things about a stock: 1) buy or don’t buy and 2) how much to buy. How much of your portfolio to put into a stock is an incredibly complex problem. A simple rule like always putting the same amount of your portfolio into every stock you buy can set that complex problem aside while you try to solve a simpler problem. Even then, you’re left with the complex problem of trying to guess what compound annual return this stock will provide should you buy it. How can you simply this problem? Well, you can take a problem that requires a quantity as the answer and turn it into one that requires only a greater than or not greater than answer. At any point in time, your portfolio will already have stocks in it. Assume you have no cash. You …

Read more
Geoff Gannon June 13, 2018

Monro (MNRO): A Durable Automotive Service Chain Executing a Roll-Up

Article by DAVE ROTTMAN


Introduction and Overview

Monro (MNRO) is a large chain of auto shops providing a wide range of automotive service and repair work in the United States with company-operated stores servicing 6.2 million cars in the fiscal 2018 year ending 03/31/2018. While originally based out of the Northeast, Monro has been executing a roll-up strategy for decades, slowly widening their coverage as they expand both south and west. As of the end of fiscal year 2018, Monro had 1,150 company-operated stores, 102 franchised locations, 5 wholesale locations, 2 retread facilities, and 2 dealer-operated stores. These locations are spread across 27 states and operate under the following brands: Monro Muffler Brake & Service, Car-X, Tread Quarters Discount Tire, Mr. Tire, Autotire Car Care Center, Tire Warehouse, Tire Barn Warehouse, Ken Towery’s Tire & Auto Care, and The Tire Choice.

One of the largest operators of automotive repair and service shops in the US, Monro has used a roll-up strategy to become one of the lowest-cost operators by building an increasingly dense network of auto shops that result in improved economics through the sharing of distribution, marketing, and management costs. Further, as a large purchaser of aftermarket auto parts, Monro enjoys relatively more bargaining power than most of its competitors. These factors have resulted in increasingly superior margins, decent economics, and consistently competitive prices for its customers. While this acquisition-based strategy has been in the works for decades, the industry is still incredibly fragmented and offers a long runway of growth for Monro to continue to deploy capital in acquiring and developing new shops. This will serve to further improve operating efficiencies, and thus economics, and allow Monro to continue to offer its work at very competitive prices.

In addition to the long runway of growth, Monro is a durable business with strong and stable cash generation. This is because people must continue to service their vehicles in all economic climates. Historically, Monro has held sales, margins, and cash flow strong during downturns. In fact, Monro is somewhat countercyclical in that when new car purchases are halted, repairs are increased. This allows Monro to do especially well in a downturn. As we approach a decade-old bull market, the new cars sales cycle begins its descent, the average age of vehicles on the road increases, the number of vehicles on the road increases, the shift away from DIY auto work continues, and the number of service bays decreases, there are a confluence of factors that bode well for Monro’s future earnings power.


The Business

Monro’s business is broken into two main categories: undercar service and repair and tire sales and service. Monro categorizes its shops as either service stores or tire stores. In reality, there is a large degree of overlap in these locations where you see the service stores doing tire work and the tire stores doing non-tire service work. For example, in 2018 23% of service stores’ revenues were related to tires, and 40% of tire …

Read more
Andrew Kuhn June 9, 2018

Hamilton Beach Brands Holding Co: HBB


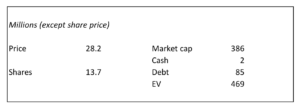
Hamilton Beach Brands Holding Co should not be a completely new stock to Focused Compounding members – but, for those who may be new I will provide a bit of a background. Hamilton Beach Brands Holding is the stock that was spun off from NACCO Industries (NC) last year, which of course NC is the stock that Geoff put 50% of his portfolio in. Hamilton Beach Brands Holding Co opened up post spin at $32.86 and quickly ran to $41.00 per share, only to fall back down to a low of $20.97. With HBB currently sitting at $28.20 about 8 months after the spinoff took place, we felt like it was worth another look.


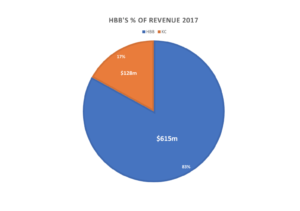
Hamilton Beach Holdings is an operating holding company that has two business segments: Hamilton Beach Brands (HBB) and Kitchen Collection (KC). HBB sells small electric household and specialty houseware appliances to brick and mortar and through e-commerce channels in about 50 different categories. They sell through Walmart, Target, Kohls, and Amazon. If you’ve ever been down a Walmart blender aisle I’m pretty confident you have come across their products. They make blenders, toaster ovens, coffee makers, indoor grills, etc. HBB’s business model is asset light because they outsource all of their manufacturing to 3rd parties in China which allows them to earn a high ROC (total CapEx for 2018 is only expected to be $10.5m, or about 1.7% of revenue). If you think about the staying power of the products that they sell it’s pretty safe to say we will still be using blenders, crockpots, and toasters 10 years into the future.


Kitchen Collection is the problem child in the business that is a specialty retailer of kitchenware in outlet and traditional malls throughout the United States. Management talked about their challenges in their last quarterly conference call, which they’re handling those challenges prudently. Their revenues fell $4.6m in the first quarter (their revenue comes from selling specialty kitchenware items in their retail stores) and management said in the conference call that they expect 70% of their leases to be one year or less by the end of 2018. Although KC is in decline mode with no favorable happy ending in sight, management is being proactive by not investing much capital into the business. Total CapEx for KC is expected to be only $500k for 2018.


For the investment case, I factored in zero value for KC.


Revenue breakdown from HBB’s most recent 10k:


What’s it worth?


Management has long-term objectives (which excludes KC) of $750m – $1B in sales with an EBIT profit margin of 9%, which would translate into an EBITDA margin of 10%. We can use this as a base in our minds, but to start let’s run through a few different scenarios to see what HBB could be worth. In the examples below, I grew revenue first by 2% for the next 5 years in addition to growing EBITDA margins to their target …

Read more
Geoff Gannon June 3, 2018

Anything Times Zero

To Focused Compounding members:
Since I read “Fortune’s Formula” and “A Man for All Markets” this past week, let’s talk blackjack. In blackjack, the player has an advantage over the casino if he’s counting cards. A card counter can bet nearly the minimum when he suspects the rest of the deck has cards unfavorable to him in higher proportion than a fresh deck and he can bet nearly the maximum when he suspects the rest of the deck has favorable cards in a higher proportion than a fresh deck. Applying this to stocks, let’s say you’re convinced Wells Fargo is a safe bank and Bank of the Ozarks is a risky bank. You have $10,000 to invest in bank stocks. These are the only two bank stocks you know anything about. You have one question: what happens if instead of taking your $10,000 and putting $5,000 into Bank of the Ozarks and $5,000 into Wells Fargo you instead put $1,000 in Bank of the Ozarks and $9,000 in Wells Fargo. You still start off with $10,000 worth of bank shares, but now you are acting like a card counter – betting nearly the maximum when you think the rest of a deck (Wells Fargo’s future) is favorable and betting nearly the minimum when you think the rest of deck (Bank of the Ozarks’ future) is unfavorable. How important is your decision to split your money 10/90 in favor of Wells Fargo?

Let’s say the chance of Wells Fargo stock going to zero in any one year is 0.5% and the chance of Bank of the Ozarks going to zero in any one year is 5%. Over a single year, a bigger annual upside – especially in the form of a quicker catalyst – can make up for a stock being 10 times riskier. Stocks are volatile. And any extra chance of a 50% pop in the stock’s price this year could overcome a 4.5% difference in the rate of catastrophe. So, if you frame your own investment lifetime as lasting only a single year – the math says it’s perfectly fine to bet as much on Bank of the Ozarks as on Wells Fargo. Catastrophic failure is not a big deal over one year. And you’ve promised yourself you’ll only play one hand. You’ll buy both Wells and Bank of the Ozarks today and sell twelve months from today no matter what. Whatever result you get won’t compound. That makes failure cheap. And if there’s some upside catalyst you see for Bank of the Ozarks this year – that catalyst could overcome the 4.5% greater chance of catastrophe this year. But, that’s framing the choice as a one-year bet. Buffett has owned Wells for 27 years. So, let’s ask: what is the difference between a 99.5% annual survival rate and a 95% annual survival rate if you’re committed to letting each bet ride for the full 30 years? Now failure isn’t cheap. It’s expensive, because it kills compounding. If you …

Read more
Geoff Gannon May 27, 2018

Value Trading – Does It Ever Make Sense?

Article by DAVE ROTTMAN

I would like to discuss and elicit feedback from our community on the topic of value trading. What I mean by value trading is the purchase and sale of stocks in a shorter time frame than traditional long-term investing, where the buy and sell decisions are driven by the exact same fundamental analysis, margin of safety standards, and owner’s mentality that traditional long-term value investors utilize. In other words, I would like to discuss the idea of a business-oriented investment strategy coupled with the willingness for a short investment holding period in certain situations.

Theory

To start, I will simplify the investment landscape by categorizing all stocks into two buckets: slow growers and compounders. Slow growers are businesses where the intrinsic value does not grow especially rapidly, and compounders are businesses where the intrinsic value does grow rapidly. All things equal, purchased at an equivalent price to value (P/V) ratio, compounders should outperform slow growers over long holding periods. This makes intuitive sense, because a large portion of the return in investing in slow growers is the narrowing of the P/V gap, whereas the large portion of the return in investing in compounders is the value itself actually increasing. This is what Charlie Munger is getting at when he said:

Over the long term it’s hard for a stock to earn a much better return than the business that underlies it earns. If a business earns 6% on capital over forty years, you’re not going to make much different than 6% return, even if you buy it at a huge discount. Conversely, if a business earns 18% on capital, you’ll end up with one hell of a return long term, even if you pay an expensive looking price.”

With that in mind, all things equal it makes sense that an investor would prefer the P/V gap to close as quickly as possible for slow growers more so than for compounders. Further, an investor who is open value trading would be more likely to trim or sell investment in slow growers rather than compounders, because with compounders there is a higher risk of selling too early, not getting back in, and missing out on the value creation that occurs for years to come.

This brings me to the practical considerations of value trading. If, as value investors, we buy businesses whose shares are available at large discounts to intrinsic value, and those shares subsequently rise quickly in price, should we hold onto those shares until the gap narrows further, or should we consider selling (at least some of the investment) and reallocating the capital to other attractive businesses with a larger price-value gap, assuming we can find such businesses? Do long-term buy and hold investors at times hurt their returns by simply holding stocks that bounce up and down, with the P/V gap narrowing and widening over time, even as the value may march steadily upwards?

I suggest that in some situation we should be willing …

Read more
Geoff Gannon May 27, 2018

Efficiency vs Reliability

Friday, May 25th – Pandora A/S (PNDORA) by LUKE ELLIOTT
Friday, May 25th – GameStop (GME) by VETLE FORSLAND
Sunday, May 27th – “Value Trading – Does It Ever Make Sense?” by DAVE ROTTMAN
To Focused Compounding members:
Two different Focused Compounding members are to blame for this week’s memo. One is Dave Rottman who wrote an article entitled “Value Trading – Does it Ever Make Sense?”. The other is someone I was talking to this week on Skype. The discussion on Skype centered on the idea that I had said somewhere before that I thought it was possible to achieve 30% annual returns. What I think I meant by this – because I’ve said it elsewhere – is that an investor who puts together a run of 30% annual returns is like a Major League player batting .400. Over a career length period of time 30% annual returns are the highest you’re likely to see. Warren Buffett roughly did it over the years he ran his partnership. Peter Lynch roughly did it over the years he ran Magellan, and Joel Greenblatt did even better at Gotham from 1985-1994. A period of 10-15 years is basically the length of a professional athlete’s career. So, we could say Buffett, Lynch, and Greenblatt were 30% annual return career hitters.

Imagine that you – a very good, but not a truly great value investor – are running a portfolio that has chugged along at 20% a year for the last 15 years. You know that other investors at other times – Buffett, Lynch, and Greenblatt – ran portfolios that chugged along at 30% a year for almost as many years as you’ve been going at this. So, you know your portfolio is running at only two-thirds of its optimal efficiency. Where is the “waste” so to speak? Why aren’t you doing 30% a year? I can think of 4 possible reasons. One, you are making mistakes they did not. Two, you are using less leverage. Three, you are putting less into each stock you own. And four, you are owning each stock longer than they did. A portfolio running at optimal efficiency would be: 1) Free from human error, 2) Leveraged, 3) Concentrated, and 4) Have a high turnover. Why would it have a high turnover? Because the portfolio manager would have more ideas than money. This is also why it would use leverage. The question of leverage brings us to the difference between efficiency and reliability. An investing system that is maxed out for efficiency will – in any given year – achieve the highest return. On the other hand, an investing system that is maxed out for reliability will last the greatest numbers of years. Compound results are a combination of efficiency and reliability. The article published this week on Focused Compounding argues that – if a value investor has enough good, reliable businesses to invest in that he knows very well – he should (like Allan Mecham does) constantly be …

Read more
Geoff Gannon May 25, 2018

Gamestop (GME): A Risky Stock that Just Might be the Cheapest Billion Dollar Stock in Today’s Market

Member write-up by Vetle Forsland


Business Overview

GameStop is the number one video game retailer in the world, the largest AT&T retailer, the largest Apple products reseller and one of the world’s largest sellers of collectibles. The company had 7,276 stores as of February 3, 2018 all over the world, with over 5,200 of them in the US. They are also one of the world’s biggest buyers and sellers of used games. That means that people buy physical video games from a shop like GameStop, and when they are tired of playing the game, they can sell the game to GameStop at a discounted price. GameStop sells these games at a higher price, which allows gamers to buy used physical games at a big discount to new games. This segment makes up the largest proportion of GameStop’s gross profit, with 32% of all gross profits, but only 23% of sales, as a result of their terrific margins.


The video game segment of the brand had about 5,900 stores as of February this year, whereas 70% of these stores were located in the US. Most of these stores are GameStop-branded, but they also own store brands like EB Games, Micromania, ThinkGeek and Zing Pop Culture. Furthermore, they own Game Informer, which is the leading video game magazine in the world, and is actually the fourth most popular magazine in the world, with over 7 million monthly paid subscribers per month. It’s also the largest digital publication in the world.


GameStop’s “Technology Brands” contains 1,329 AT&T branded retail stores, where they sell AT&T services, DIRECTV service and electronic products. This segment also consists of 48 Simply Mac branded stores which sell and repair Apple products. Their technology brands make up 8.7% of sales and 19.5% of gross profits. It was a part of their attempt a couple of years ago to diversify away from the video game industry, and it has since been deemed unsuccessful as they recently wrote off about $360 million from the technology brands business. GameStop was pressed to decrease the equity value of the investment as they realized phone owners won’t switch models as frequently as in the past, which makes sense; newer phones aren’t evolving as drastically in quality as they used to.


The consensus today is that GameStop’s business – a video game retailer – is redundant in an age of online shopping. GameStop’s flagship “products” have always been hardware like the newest consoles and physical video games. However, PC Gamers have almost exclusively stopped buying physical video games, as only 20% of all PC games were sold in physical form last year. GameStop shareholders fear that the same will happen to console games and consoles. These two segments, if we include their used games segment, made up 57% of gross profit in 2017. So, I guess in an absolute worst case scenario, where all console gamers switch to digital, GameStop will lose around 60% of their value. The stock has fallen 80% …

Read more
Andrew Kuhn May 25, 2018

Pandora A/S (CPH: PNDORA)

Member Write-up by Luke Elliot


Note: Sponsored ¼ share ADRs also trade under “PANDY” in U.S. Dollars


Pandora A/S is the largest jewelry maker in the world 

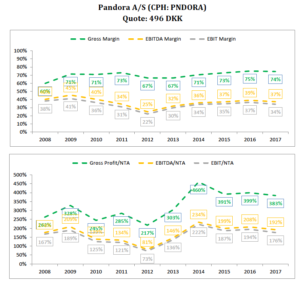
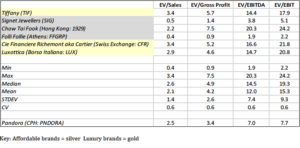
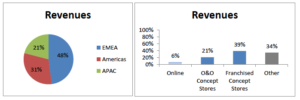
Overview Pandora is a vertically integrated jewelry maker that has rapidly grown from a local Danish Jeweler’s shop to the world’s largest jewelry manufacturer, producing more than 100 million pieces of jewelry in 2017. The original jeweler’s shop in Copenhagen, Denmark, was opened by goldsmith Per Enevoldsen and his wife Winnie in 1982. The company quickly transformed from a local shop, to a wholesale retailer, to a fully integrated global behemoth that designs, manufactures, directly distributes (in most markets), and retails its own jewelry. The company now sells in more than 100 countries through 7,800 points of sale. If you’ve ever been to a grade-A mall during Christmas or Valentine’s Day, you’ve probably witnessed the crazy lines snaking out of their small glass stores. Jewelry makers are segmented by price: Affordable (less than 1,500 USD), Luxury (1,500-10,000 USD) and High-End (greater than 10,000 USD). Pandora is in the affordable category by price but claims to have an ‘affordable-luxury’ brand. The company gets a little less than half (48%) its sales from EMEA (with 71% coming from UK, Italy, France, and Germany), about one-third (31%) from Americas (with 74% from US) and one-fifth (21%) from APAC (with 43% from Australia and 28% from China). The company’s sales are geographically diverse and in mature markets. To make it easy, let’s break down Pandora’s business model into two main retail formats:

1) Concept Stores (about one-third owned and operated by the company and two-thirds franchised): Concept stores are full-blown branded Pandora stores which only carry Pandora products and displays.


2) Other: other points of sale consist of “shop-in-shops” which are clearly defined spaces in other stores (think a little kiosk in an airport Duty-free) that only carry Pandora products and 3rd party distributors which can be either multi-branded retailers or non-branded retailers.


Pandora currently gets 66% of its sales from Concept Stores (plus online) and 34% from “other.”


We’ve discussed where the company sells and how they sell……..but What do they sell?


Pandora is the world leader in charms and charm bracelets. It’s their bread and butter. It’s estimated they own about 30% of the charm market and 75% of their revenues are generated from this category. Estimates are that charms and charm bracelets make up only 6% of the total jewelry market. In essence, Pandora sells you a bracelet for somewhere between $80-150 and then you fill the bracelet up with charms that are $50-150 each. Pandora sells 73 million charms per year (200,000 per day) and 14.5 million bracelets per year (40,000 per day). Pandora’s brand and leadership position in the charm niche is by far its most important asset.

Durability


  The most prevalent risks to the durability of the company are a decline in the popularity of charm bracelets or a
Read more
Geoff Gannon May 20, 2018

Human Nature is the Ultimate Hidden Fee

Tuesday, May 15th – Box (BOX) by Jayden Preston
To Focused Compounding members:
In an interview this week with Barron’s, Vanguard founder Jack Bogle cited stats that showed the average investor’s annual return from index funds was 8.4% from 2005 to 2017, from actively managed funds it was 7.2%, and from ETFs it was just 5.5%. ETFs and index funds are invested in much the same things. So, investors are charging themselves a 2.9% annual fee in the form of bad timing. The same Barron’s article quotes BlackRock’s Larry Fink as saying: “..long-termism is better than short-termism. But people need financial instruments for different reasons.” This is the common argument for the existence of ETFs, long-short hedge funds, etc. But, it’s wrong. We’re talking about a drag of 3% a year between investors staying in a representative sample of U.S. public companies and investors trading in and out of those same assets. This past week, Andrew and I announced we’ll be handling managed accounts. People who have called in have mostly wanted to talk about the fee. I like a 2.5% fixed fee because the math that matters is easy for me to do in my head. We should only accept money when we feel we can still beat the market by more than 2.5% a year after taking on that sum. Different kinds of investment vehicles have different kinds of hidden fees. These fees often add up to more than the amount you’re actually being charged. I spent a good part of last week warning Andrew about the performance drag we’d experience if we either: 1) Held more stocks or 2) Managed more assets. Both would create big performance drags. For ETFs, the hidden fee is bad timing. Investors want the freedom to trade in and out of an ETF. And that freedom costs them 3% a year. For accounts like Andrew and I will be running – the hidden fee is size. I guarantee you you’ll be better off when we are running $1 million instead of $10 million or $10 million instead of $100 million. Andrew and I won’t be better off. But, you will be. Here’s the thing. When money managers charge a percent of profits, they like to say their interests and their clients’ interest are aligned. But, the truth is that the manager’s interest and the client’s interest are never aligned on the one question that matters most: “Should we gather more assets?” The bigger a fund gets, the worse its performance will be. The more an investor trades in and out of ETFs, the worse his performance will be. Hidden fees like these often add up to more than the actual fee you’re charged. Whatever fees a fund is charging you, it’s going to be very hard to overcome the hidden cost of either high turnover or a large amount of assets to actively deploy. Small, active funds can work well. And giant, inactive funds can work well. Everything in between that tends …

Read more
Geoff Gannon May 15, 2018

Box (BOX): Negative Earnings and Free Cash Flow Disguise Beautiful Customer Economics

Member write-up by Jayden Preston


Overview


Founded in 2005, Box offers a cloud content management platform, as a subscription-based service, that enables organizations of all sizes to securely manage and access files from anywhere, on any device. The company initially offered a free version in hopes of growing their user base rapidly, leading them to surpass 1 million registered users by July 2007. The Company realized that their users started bringing their solutions into the workplace and businesses were eager for a solution to empower user-friendly content sharing and collaboration in a secure, manageable way. In 2007, Box then made the strategic decision to focus more on the enterprise market by investing heavily to enhance the security of their platform and building an enterprise sales team. In 2012, Box introduced Box OneCloud platform and Box Embed framework to encourage developers and independent software vendors to build applications that connect to Box, creating an ecosystem of applications. The Company has also formed alliances with numerous software companies, bringing about more than 1,400 integrations with offerings from Google, Office 365, IBM and so on. This continual evolution of their platform features allowed the Company to sell into increasingly larger organizations.


Today, Box has a user base of over 58 million users. As of January 31, 2018, over 17% of their registered users, or close to 10 million, were paying users who registered as part of a larger enterprise or business account or by using a paid personal account. The Company has over 82,000 paying corporates. Around 70% of the Fortune 500 companies are their clients. In FY2018, Box generated $506 million in revenue, in which 96% is recurring.


Durability and Moat


With cloud content management business being the newer technology and current disrupter, it is difficult to see what would come and disrupt this business in the next decade or two.


The value proposition of cloud content management should be strong. Not only does the cloud allow for higher flexibility in accessing content and collaboration among colleagues, it also helps corporates cut costs through streamlining the content management process. Increasingly, through more integrations with other software offerings, the value proposition of cloud content management should only increase.


Complementing the above is Box’s strategic focus on the enterprise market. During the sales process of convincing a large enterprise to sign up as a client, Box often finds the need to tailor its offerings to the needs of the enterprise. This should increase the switching costs for the users. It is quite expensive to acquire such customers. For instance, by the end of FY2017, Box had 71,000 customers, covering 64% of the Fortune 500. The Company spent $303 million on sales and marketing in FY2018, during which the number of corporate customers increased by around 12,840. (Here I assume FY2017 year-end number of customers decreased by 4%. The difference between this number and the FY2018 year-end figure should equal to the number of new customers added) Assuming …

Read more