Safestyle has the #1 position in the UK replacement window and doors segment.
The company has a simple, proven business model that has seen them grow market share for 12 consecutive years (up from 4.1% in 2005 to 11.2% in 1H2017).
Safestyle has a Fort Knox balance sheet with net cash position of 17MM GBP.
The business is highly cash-generative with negative working capital. Long-term median returns on tangible capital are greater than 200%.
An increasingly regulated market suits larger business’ that have the infrastructure to operate within the regulations.
Fragmented market + structural competitive advantages + superior proposition = sustainable market share gains + opportunities for margin enhancement.
Market should grow at long-term nominal GDP of 3-4%, but through market share gains, Safestyle should grow revenues at >4% and earnings at >6% per annum over the next cycle.
Long-time CEO with skin in the game and history of good execution.
Historical P50 P/E of 15 and P50 EV/EBIT of 11.7 for a company with net cash, very good profitability, and good growth seem very conservative, but the current P/E of 10.9 and EV/EBIT of 7.8 seems way too cheap.
5-year annualized return of 19 to 24% seems possible (9-10% FCF yield + 4-6% earnings growth + 6-8% multiple expansion).
The main risk is an economic slowdown in the UK that sees a reduction in renovation, maintenance, & improvement (RMI) spending. There are already signs of this occurring in the segment; however, Safestyle has historically taken market share in tough market conditions and is well placed to do so again.
Fellow Focused Compounding member Kevin Wilde has written two posts on The Cheesecake Factory (over at the “Idea Exchange”). I suggest you read his posts first to get a better glimpse at the company’s financials. This article is intended to be a more qualitative one.
Overview
Originated in 1972, the predecessor of The Cheesecake Factory was a bakery operation founded by the parents of Chairman David Overton in Los Angeles. In 1978, David Overton led the creation and operation of the first The Cheesecake Factory restaurant in Beverly Hills, California. This essentially led to the inception of the upscale casual dining segment in the US.
Fast forward nearly 40 years, The Cheesecake Factory now operates 209 Company-owned restaurants, comprised of 195 restaurants under The Cheesecake Factory brand name; 13 restaurants under the Grand Lux Café mark and one restaurant under the Rock Sugar Pan Asian Kitchen name. Internationally, 18 The Cheesecake Factory restaurants are operated through licensing agreements by their partners overseas. The Company also has a baking segment, running two bakery production facilities in the US. All the cheesecakes served in their restaurants, including international licensees and third party bakery customers, are made at either of these two facilities.
Operating in the upscale casual dining segment, their average check per customer, including beverages and desserts, is above $20 per customer.
In Nov 2016, they have also invested $42 million for minority stakes in two concepts, North Italia and Flower Child, and will provide growth capital for them going forward.
As restaurants bearing The Cheesecake Factory brand still delivers most of the value in this company, we will focus our following analysis on them.
Major Differentiation Points
Their restaurants are different from most restaurant chains in the following ways:
Except their desserts being produced at their bakery facilities, substantially all other menu items are prepared from scratch locally at their restaurants, with fresh ingredients.
Their restaurants are huge with size ranging from 8,000 square feet to 12,000 square feet.
The capital investment per square foot for each of their restaurant is thus higher than most, even in the casual dining industry. It usually costs $8 million or more to set up one new restaurant.
Offsetting point number 3 is the unusually high sales per square foot generated in their restaurants. Particularly, the average The Cheesecake Factory restaurant generates above $10 million in sales per year, averaging close to $1,000 in sales per productive square feet.
Extensive menu covering a huge variety of dishes, appealing to a diverse customer base across a broad demographic range. The Cheesecake Factory menu features more than 200 dishes. The menu is updated twice every year.
Higher percentage of sales from desserts than average. Dessert sales was 16% of revenue in FY2016.
Durability
The business of restaurants is durable as long as humans exist, because I believe eating out will never go extinct. Instead, a …
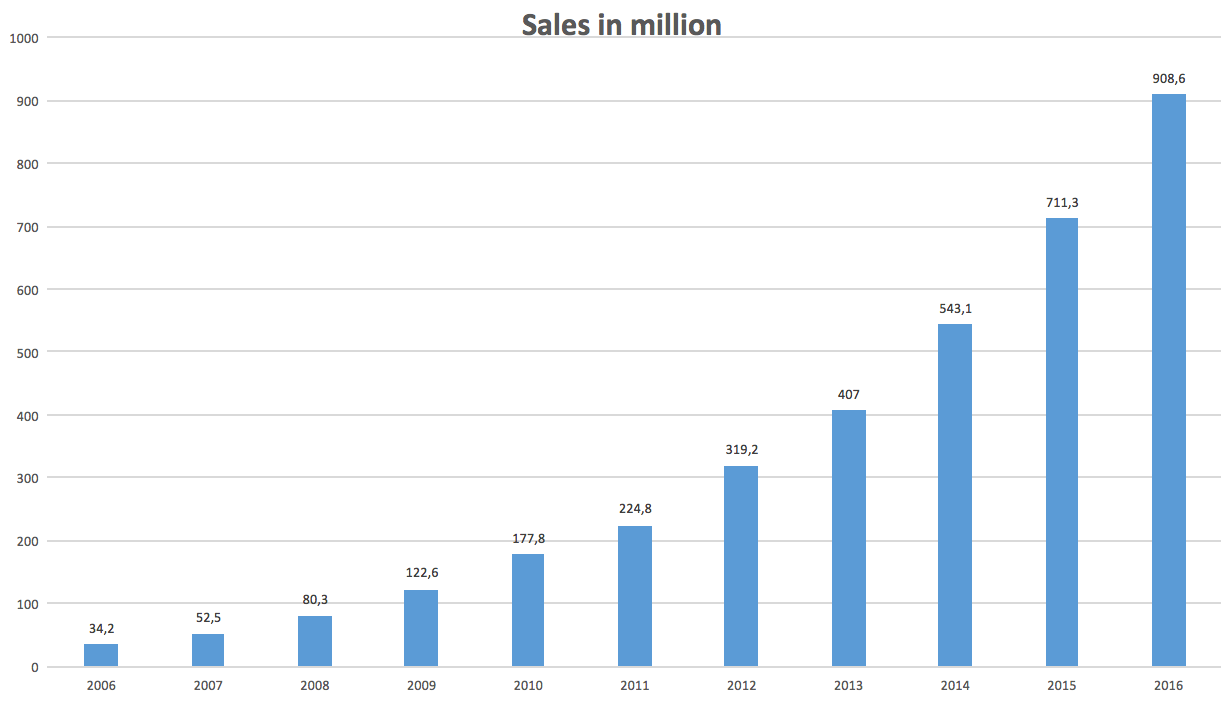
Zooplus is the leading online pet food retailer in Europe. It has on average grown sales 38% annually since 2006 (IPO in 2008) and annualized sales growth since 2010 is a 31%. In 2016 sales grew by 28%, to 908 million EUR, and there is room for additional expansion. Generally, the retailer with lowest prices and best customer service will come out as the industry leader. I believe this will be Zooplus. Lower prices and good customer service will lead to a high customer retention rate, the latter being at 92 % today. At the same time, this is a company with a lot of room for future growth, good financials and no debt.
Since its foundation, Zooplus has grown to become the clear leader in online pet supplies in Europe. The company also ranks number 3 in the overall European market for pet supplies after Fressnapf and Pets at Home. As Zooplus grows, it will become more cost efficient through economies of scale. More revenue will justify building distributing centers, which will bring the depressed margins today upwards, and create a good profit for shareholders.
Zooplus was formed in 1999, and has been operating in the pet market for more than 17 years, and on the way launched their business model in 30 countries. Pet supplies is a big segment of the European retail industry. In 2016, gross sales of pet supplies added up to around 26 billion EUR. Because of higher populations and more pets in the majority of countries, I expect this figure to continue growing over the years. Furthermore, Europe is expected to see considerable growth in online retailing, which will propel Zooplus’ sales momentum.
Pet supplies is not a cyclical industry. Sure, people will try to avoid high-end pet food brands in economic downtrends – but unless they want Kitty to starve, pet food will forever be in high demand. I believe Zooplus is in a good position to make money from these facts.
Online groceries have not lived up to the potential they once were estimated to have, so why do I think customers will shift to online pet supplies in the future? (only 6.8% of pet supplies are sold online). First of all, our beloved pets need food just as much as we do. As pet food has a (very) long expiration period, pet owners will want to buy it in bulks for lower prices – to make sure they’re never out of food for the little ones. That’s how my parents (and I) buy pet food in Norway. However, in brick and mortar stores, it is problematic for customers to buy in large bulks, since they actually have to carry the bags from the store and home. Additionally, Europeans live in dense and urban areas, where public transportation/walking is more common, making it even more difficult to buy pet food in bigger bulks.
CARS- Cars.com recently completed the spinoff from their parent company Tegna Inc, and started trading as its own publicly traded company on June 1st. Geoff and I did some research on the company a little over a month ago and we have been watching from the sidelines ever since. Cars.com is a very capital-light, cash flow generative company with a solid brand and one I would say is not going to “go-away” within the next 10 years. This all being said, they operate and compete in a very crowded space and their competitors are spending much more of a % of revenue on marketing than Cars.com is. Geoff and I thought a lot about this and we couldn’t exactly figure out why.
Their Main Competitors Are..
Truecar
CarGurus
Autotrader
From looking at the other competing company websites I would say that Truecar and Cars.com is the best-looking website out of the group. Here is a quick breakdown of their financials where you will see the % of revenue spent on marketing.
Cars.com
TrueCar
CarGuru
Sales
309.8
157.6
143.3
Cost of sales
-4.7
-13.5
-7.7
Marketing
-109.5
-89.1
-104.6
EBIT
56.2
-13.6
12.2
Marketing % of sales
35%
57%
73%
EBIT Margin
18%
-9%
9%
Management is forecasting revenue to finish down -1% in 2017, which obviously is not too appealing to many investors. This being said, CFO Sheehan has said in an earnings call that they expect the business to grow in 2018. After the spinoff, Cars.com opened at $25.34 and now currently trades at $24.47. The stock probably has not performed well since the spinoff due to the parting gift to Tegna of $650m. But, due to the companies cash flow generative nature, I don’t believe this will be an issue going forward. Also, I believe the stock currently is priced as a “no growth going forward” type of stock. If they can resume to top line growth and continue to produce significant free cash flow, I think if the stock falls back down to the $20 per share area it can make for an interesting investment over the next 2-5 years. This company is on my watch list of a company I would like to own at a future price if given the chance by Mr. Market.
Market Cap ($Mil)
EV/EBITDA
P/S
EBITDA MARGIN
Cars.com
$1,755
10.1x
1.17
37%
TrueCar
$1,180
N/A
3.43
-5.70%
CarGurus
$2,266
99.4x
10
10.40%
Auto Trader
$4,210
16.3x
10.57
67.80%
Papa John’s
PZZA – I started to get interested in learning more about Papa John’s business because first, I love pizza (who doesn’t?) and second, because I saw in the news that Papa John’s was blaming the NFL on slowing pizza sales, which caused sort of a media frenzy. Although I don’t know if Papa John’s blaming the NFL on slowing pizza sales is a valid claim or an excuse, I’m not exactly sure if the stock is exactly cheap. In addition, Domino’s Pizza is definitely a far …
“(My) strategy is very simply to make meaningful investments in good companies when their stocks are undervalued.
This is obviously what most investors are trying to do…”
Like John, I used to think that this is what most investors were trying to do. However, the thousands of email exchanges I’ve had over the 12 years I’ve been writing this blog have taught me that most investors are not trying to “make meaningful investments in good companies when their stocks are undervalued.”
Let’s break this statement down to see what I mean:
1. Make meaningful investments
2. In good companies
3. When their stocks are undervalued
We have 3 key words there:
1. Meaningful
2. Good
3. Undervalued
Make Meaningful Investments
What is a meaningful investment?
“Meaningful Investments” According to Me
My minimum position size is around 20%. My maximum position size is around 50%. I usually own 3-5 stocks. I often have some cash.
At the start of this quarter, my portfolio was more concentrated than usual. I had 50% of my portfolio in my top stock alone, 78% in my top 2 stocks combined, and 92% in my top 3 stocks combined.
“Meaningful Investments” According to Joel Greenblatt
Quote:“After purchasing six or eight stocks in different industries, the benefit of adding even more stocks to your portfolio in an effort to reduce risk is small.”
Answer: A meaningful investment is 13% to 17% of your portfolio (1/8 = 12.5%; 1/6 = 16.67%).
“Meaningful Investments” According to Warren Buffett
Quote:“Charlie and I operated mostly with five positions. If I were running $50, $100, $200 million, I would have 80 percent in five positions, with 25 percent for the largest.”
Answer: A meaningful investment is 16% to 25% (80%/5 = 16%).
“Meaningful Investments” According to Charlie Munger
Quote: “If you are going to operate for 30 years and only own 3 securities but you had an expectancy of outperforming averages of say 4 points a year or something like that on each of those 3 securities, how much of a chance are you taking when you get a wildly worse result on the average? I’d work that out mathematically, and assuming you’d stay for 30 years, you’d have a more volatile record but the long-term expectancy was, in terms of disaster prevention, plenty good enough for 3 securities.”
Answer: A meaningful investment is 33% (1/3 = 33.33%).
So, the above value investors (jointly) define a “meaningful investment” to be in the range of 13% to 33% of your total portfolio.
Over the last 12 years, I’ve discussed position size with dozens of individual investors. Maybe five of them take “normal” positions of 13% to 33% of their portfolio. I would estimate that at least 85% of investors do not try to …
In response to an email a reader sent about some of my recent posts on the difference between investment and speculation, I entered lecture mode…
I am especially worried about the tendency among readers to speculate using the logic that value investors (like me) are sometimes wrong (like in WTW) and these “investments” turn out to be speculations. Therefore, how is buying at 8 times EBITDA in what has historically been a fairly predictable company different from buying at 16 times EBITDA in a company that hasn’t historically been predictable? Aren’t they both speculations since you are always ultimately going to make money or lose money based on how right you are about the future?
Are You Better Off Than You Were 8 Years Ago? – Are You a Better Investor?
I feel this is an issue with the length of the latest bull market. Whether or not stocks are very expensive (and I do find them expensive generally, but this point still stands if I’m wrong about that), most readers of the blog have seen mostly good results from the stocks they’ve chosen to hold over the last 8 years now. Eight years is a long time. Many people have not even been following the same investment strategy for more than 8 years.
Their current approach has never been battle tested.
So, now I hear a lot from people who are more into paying up for higher quality, holding longer, etc. There are ways of implementing a strategy like that which work. But, I think the experience of the “recent” past is what gets them thinking in these directions.
Although I’m “only” 32, I was investing seriously (in terms of how much time I spent thinking about the subject) in 1999-2002 and in 2007-2009. Now, most years are not like 1999-2002 or 2007-2009. But neither are they like the run from the second half of 2009 through to today (the end of 2017). That kind of run is rarely this smooth. And so, when you have not seen a period with P/E multiples of even good stocks contracting 30% or 50% or more – you are less worried about the distinction between investment and speculation.
When you look at something I own like BWX Technologies (BWXT), which has performed well both as a business and as a stock, you see that it is now trading at 31 times earnings. It’s a great business. But, even if it is always recognized as a great business by the market – it may yet be assigned a P/E of 20 instead of 31. Great businesses sometimes trade at a P/E of 20. So, right there, you have the potential for a 35% decline in the price of this stock.
I still own the stock. And I’ll keep owning it till I know for sure that whatever new stock I want to buy is better than holding on to this stock. But, what is always foremost in my mind when …
Someone emailed me asking what sources they needed to study to get better at valuing stocks.
My answer was that the ability to come up with accurate valuations for public companies is overrated.
Why? Because…
It’s rarely important to know how to value a company. What’s important is the ability to recognize when a company is clearly selling for less than it’s worth and then acting on that knowledge.
For example, in a write-up I did on my member site (Focused Compounding) explaining why I put 50% of my portfolio into NACCO (NC) when it completed the spin-off of Hamilton Beach (HBB), I said that:
“I think of each share of NACCO as an inflation adjusted stream of free cash flow. As I’ve shown, I think the stream has a ‘coupon’ of greater than $3.25 and I bought it at $32.50. So, the yield is 10% or more and that’s effectively a ‘real’ yield.
The average U.S. stock has a free cash flow yield in the 4% to 5% range and that yield is not as well protected against inflation.
It’s true that NACCO’s yield will eventually decline as coal power plants shut down (although, in recent years, the tons of coal supplied has risen rather than fallen). However, I think of my ‘margin of safety’ as being the fact that it isn’t 100% certain these plants will shut down and they haven’t shut down yet. Till they do, cash will build up on the balance sheet of NACCO (the parent company) or it will pay out dividends, buy back stock, or acquire businesses unrelated to coal mining (as it did in the past).”
It’s important to note that:
1) I never said that NACCO’s cash earning power is $3.25 a share. I said it’s at least $3.25.
2) I never said that the right multiple for NACCO is 10 times FCF. I just said that a normal stock trades for 20-25 times FCF (a 4% to 5% FCF yield) and NACCO trades for no more than 10 times FCF.
In fact, in that same article, I walk through ways of estimating what cash earnings would be in a normal year for NACCO (now that’s it just the coal business). The range of earnings estimates these different methods give you actually cluster around $4.75 to $5.50 a share (not the $3.25 figure I cite). However, I didn’t think those numbers were important when the stock was at $32.50.
Why? Because…
Earnings of $4.75 to $5.50 on a $32.50 stock are overkill. You don’t need to know if a stock has a P/E of 6 to 7. What you need to know is how certain it is that a stock doesn’t have a P/E any higher than 10 to 11.
So, I spent more time focusing on the fact that the method of estimating earnings that was most conservative – using this year’s tons of production and multiplying it by the lowest ever profit per ton the company achieved in …
I’m a big process guy. I believe if you have the correct processes in place and develop the right habits over time, you will succeed in whatever it is that you want to accomplish. Geoff and I get asked all the time a variation of: How do I become a better investor? The answer is simple, but not easy. I would say it really boils down to reading. A lot. Okay okay yes, I know if you are a Buffett / Munger fan you probably already know that. But, what should you read to get better? I believe people waste their time reading too many books on theory, when really, they can become a better investor overtime by reading one 10k after another. Geoff said it best in one of his blog posts when he said: if you’re reading more books than 10ks, you’re doing it all wrong. Truth be told, I once fell into this category. I felt like If I read more investing theory books it would help me overall as an investor. While this is true, I feel like once you have the basics down and a solid rational way of thinking about stocks and the market, from there on out all you will need to do is read and learn about different businesses and practice valuing them. If someone came to me today and asked me how to get started in investing, I would point them in this direction:
While reading books of course is beneficial and fun, I believe if you want to get better as an investor the 6 things I just listed above is all you need to know fundamentally speaking. From there you can proceed to reading 10k’s, which is the main activity that will make you better. As you may or may not know, Geoff and I meet 1-2 times a week. This topic of “how to get better” and “focus” is one that we talk about often and is one of great interest to me. Here is some tough love on how to get better. Stop being so lazy. If you want to get better, then get better. The opportunity is 100% there. I always say we are living in the luckiest time in life because of the technology that’s available to us that allows us to get access to whatever it is we want to learn about. Think about how much that has changed within the last 15-20 years. Being in Dallas, I could have a package shipped to China tomorrow if I wanted to. Technology has changed and gotten better, so we must adapt to get better. Think …
“Really interesting post today, but I was wondering how you would evaluate the Weight Watchers (WTW) situation.
It seems like an investment that turned into a speculative situation.
I think there are a couple of cases like this where a seemingly safe investment turns into a very speculative situation. Fossil (FOSL) is another one that comes to mind. Even though it had some debt, nobody would think that it would have an existential crisis at some point due to changes in business and the weight of its debt. I don’t think anybody would have called it a speculation 3 years ago at over $100 a share. But on the other hand, it’s speculative now at under $7 a share.
On the other hand you have situations like Facebook (FB) which IPO’d at an extremely speculative price but the business turned out to be so strong that even at that price, it morphed into an excellent investment had the margins not expanded so much.
I’m not saying that’s the case for Amazon or Netflix today, but maybe it’s not so easy to distinguish between investment and speculation in some cases because there are factors that we cannot foresee or do not yet understand. If you have the knowledge that it’s almost certain the company will grow into and beyond the current valuation, then perhaps it would be a good investment at what others may consider to be a speculative price.
If you know that a business could potentially come under hard times and the modest amount of debt it has could compound the problem, then a company with a very modest valuation may morph into a speculative stock at even 1/10th the original price a few years down the road.
In the end, a lot of it depends on what you really know I think.”
George Orwell wrote an essay called “Politics and the English Language”. One passage from that essay is helpful to quote here:
“The word Fascism has now no meaning except in so far as it signifies ‘something not desirable’. The words democracy, socialism, freedom, patriotic, realistic, justice have each of them several different meanings which cannot be reconciled with one another. In the case of a word like democracy, not only is there no agreed definition, but the attempt to make one is resisted from all sides. It is almost universally felt that when we call a country democratic we are praising it: consequently the defenders of every kind of regime claim that it is a democracy, and fear that they might have to stop using that word if it were tied down to any one meaning.”
The word “democracy” has an actual definition, etymology, and history we can trace. The etymology is Greek. It means literally …
Auto dealership groups with scale are attractive businesses with good profitability and attractive growth opportunities driven by industry consolidation.
Dealership franchises are protected from competition by regional exclusivity. They earn high margins on vehicle parts & servicing by acting as the warranty arms and parts distributors for their major automaker partners.
Despite similar economics and growth opportunities, U.K. auto dealerships look cheap relative to their global counterparts. Vertu Motors plc (LSE:VTU) looks particularly cheap despite less debt / risk, better past growth, improving margins & profitability, much better cash flow generation, and better growth opportunities.
Vertu Motors has a great management team including a young founder / CEO with skin in the game, a sound strategy / track record of execution, and excellent capital allocation.
The largest dealership groups have the unique ability to thrive in both good times in bad. Profitability is better during downturns in the economy that you’d expect while offering significant opportunities for further industry consolidation at attractive prices.
Key industry risks sound worse than they probably are. Threats to the dealership model are likely overblown because OEMs are unlikely to abolish it and online retailers like Amazon have numerous hurdles to overcome to compete directly with dealerships (eg. Distribution & servicing outlets). It is unclear whether ride sharing is a threat or a boon to dealership sales & profitability and the impacts of autonomous vehicles is farther off than valuations suggest.
OVERALL: Vertu Motors is an above average business, with excellent management, a reasonable risk profile, trading at a very attractive price.
Industry Overview
How do auto dealerships make money?
Most automotive dealers sell new & used vehicles and automotive services (including maintenance & repair).
They also often help arrange automotive finance and insurance products for their customers. Many sell parts & accessories as well.
Ultimately, car dealers have four key goals: sell you a car; sell you a car loan (or get you to lease the car); sell you insurance; and get you back to the dealership for service and eventually a trade in.
What geographic regions did I study?
I looked at four regions of the world with established auto dealership groups: North America, Europe, Oceania, and the U.K.
What are the business economics like?
Dealerships get more than half of their revenues from new-vehicle sales, but most of car dealership profits come from the sale of used cars, parts and service, from acting as a middleman in securing loans and leases, and from the sale of so-called Finance & Insurance products like extended-service contracts. The key to the business is less about making huge profits on the sale of new cars and more about the repeat business from servicing those vehicles.
While there is small need for capital (dealers ‘floorplan’ their operations, with auto finance companies and other lenders owning the cars that have been sold), the initial capital outlay to build a dealership can be immense (in the U.S., a larger auto dealership can cost $20-$30MM to build), and due