Geoff Gannon March 30, 2019

Revisiting Keweenaw Land Association (KEWL): The Annual Report and the Once Every 3-Year Appraisal of its Timberland Are Out

Accounts I manage hold shares of Keweenaw Land Association (KEWL). I’ve written about it twice before:

Keweenaw Land Association: Buy Timberland at Appraisal Value – Get a Proxy Battle for Free

And

Why I’ve Passed on Keweenaw Land Association – So Far

I didn’t continue to pass on Keweenaw Land Association. Like I said, the stock is now in accounts I manage.

There are really two things worth updating you on. One is the annual report. The other is the appraisal. The appraisal is something the old management team – the one that lost last year’s proxy vote to Cornwall Capital – always did as well.

So, I can show you a summary of every appraisal from 2006 through 2018. The company includes this in its annual report:

You can read the entire annual report here.

A full summary of this year’s appraisal and methods used by the appraiser can be found here.

In today’s article: I’ll focus on the appraisal, because valuation of the stock seems to be the thing readers are most interested in. The annual report is also quite interesting though. The company’s new management is disclosing far more than the previous management. Although Keweenaw stock is “dark” (it doesn’t file with the SEC) – this latest annual report reads like a typical 10-K filed with the SEC. The company also changed its auditor to a better known firm (Grant Thornton) that audits plenty of other public companies.

As you can see in the table above, the value per acre of KEWL’s timberland was appraised at $809 this year versus $901 in 2015. That’s a decline of 10% versus 3 years ago. It’s also basically flat with an appraisal done in 2009 (so nearly 10 years ago). These are also nominal numbers. So, that means that the real value of KEWL has declined on a per acre basis over the last decade.

What’s tricky about this though is the last row you see “appraisal as a percent of standing inventory”. As you can see, the effective gross timber value – this is the value of all of the wood on Keweenaw’s land less the estimated gross costs of cutting and trucking that timber away – has risen pretty consistently. It went from $728 an acre in 2009 to $1,130 an acre today. But, the appraisal as a percent of that standing inventory went from 110% in 2009 – meaning the appraiser was then valuing the timberland above the gross value of the timber itself – down to just 72% this year. You can also see that the physical volume of timber – measured in cord equivalents – has compounded at something like 4% a year over the last 12 years. So, physically there is more timber on Keweenaw’s land every 3 years – and at least in the 2012, 2015, and 2018 appraisals this timber’s value has also increased per acre every time. However, the property’s appraisal has not. In fact, it declined by …

Read more
Geoff Gannon March 26, 2019

Ball (BLL): A Debt Laden, “Economic Value Added” Obsessed Organization with a Super Wide Moat

Write-up by Mister Compounder


The 3 most important variables to the Ball (BLL) investment thesis are:

  1. The industry structure and the symbiotic relationship with beverage companies, that naturally leads to “survival of the fattest”.
  2. The EVA approach that links interesting site economics to the creation of shareholder value.
  3. Credit risk (having the right level of debt).


Ball is one of the world’s leading suppliers of metal packaging to the beverage and food industry. The company has a long history and was founded in 1880. Through its entire history, Ball has been involved in close to fifty different segments. Today, the business is mainly based on delivering aluminum beverage containers to the beverage industry. The company’s business is about delivering aluminum cans to large consumer staple companies like: Coca Cola, Unilever and AB InBev.

This sounds like a really dull, capital intensive and boring business. So, why should it interest you?


Interesting Site Economics

The source of Ball´s competitive advantage is dependent on local scale and switching costs, resting on a highly consolidated industry among both producers and customers. The plants making the beverage container cans are huge. This is best illustrated by the size range of the production plants from about 100,000 square feet to around 700,000 square feet. The company’s largest site is the Findlay, Ohio plant (733,000 square feet) that produces both beverage cans containers and food containers.


To get an understanding of the underlying unit economics driving both revenue and profitability at Ball, it might be interesting to do some guesstimates on the profitability of the site locations.


In the North American segment, the beverage container industry represents about 110 billion units, where five companies dominate the market in the U.S, Canada and Mexico. For fiscal year of 2017, Ball produced 46 billion units, hitting a market share of 42%. This volume is served by 19 plants in the US, 1 in Canada and 2 in Mexico. They have also one joint venture production facility, but I have not included that one in this calculation. In total 22 plants, which means an average of 2.1 billion units per plant per year.


This means that – each year – the typical Ball plant should make:

  • 1 billion units
  • $190 million in revenues
  • $37 million in gross profit at a 19.5% gross profit margin
  • $25 million in operating profit at a 13% operating margin
  • Which is: $624 of revenue per square foot in and $81 in profit per square foot


Ball typically generates 9 cents in revenues per beverage can and 1.2 cents in operating profit per can. This is what generates sales and earnings at Ball. In other words, these are huge operations. Just like with distributors, it will be difficult to compete with a fully functioning and operative production plant. Given this, it is highly unlikely that a competitor would add excess capacity near an existing plant. It leads naturally to local markets as it does not make sense to transport the products …

Read more
Geoff Gannon March 21, 2019

IEH Corporation (IEHC): May Be a Good, Cheap Stock – But, Definitely in the “Too Hard” Pile for Now

As this is an initial interest post, it’ll follow my usual approach of talking you through what I saw in this stock that caught my eye and earned it a spot near the top of my research watch list – and then what problems I saw that earned it a low initial interest score.

I’ll spoil it for you here. IEH Corporation (IEHC) is a stock I’m unlikely to follow up on because of the difficulty of digging up the kind of info that would make me confident enough about a couple key problem areas I’ll be discussing below.

I think I have a pretty biased view of this stock. Or, at least, some of what I’ll be discussing in this article might give you a negative, biased impression of the stock. And there are actually a lot of good things here. So, I’d like to start by linking to some bloggers who have discussed this stock in-depth in a way that’s different from some of what I’ll be focusing on here.

I recommend you read theses posts:

“My Trip to the IEHC Annual Meeting” – Bull, Bear and Value (2014)

“Why I Bought IEHC” – Bull, Bear and Value (2013)

“IEH Corporation (IEHC)” – OTC Adventures

“IEH Corporation: A Tiny Company with the Potential for a Big Dividend” – Weighing Machine (2013)

“Recent Numbers at this Company Say Buy, Hand over Fist” – Dylan Byrd (2015)

“IEH Corp (IEHC)” – Value Investors Club (2013)

In case you chose not to click those links, I’ll give you a quick explanation for why I might be interested in this stock at first glance.


It’s Overlooked

The stock is overlooked. I manage accounts that focus on “overlooked” stocks.

This stock has a $40 million market cap – of which, probably close to 50% doesn’t actually trade (it’s owned by insiders, etc.). So, we’re talking about a “float” of about $20 million or $25 million. Something quite small.

The company also does something quite boring. It makes connectors which go into products assembled by defense contractors serving the military, space, and aerospace industries. Investors would know the end products this company’s output goes into – Boeing 737, Airbus A380, F-35, Apache AH-64, Hubble Telescope, etc. And investors would know the customers who buy connectors from IEH – Raytheon, Northrup, Honeywell, Lockheed, NASA, etc. But, neither the company itself nor the products it produces would be high visibility to investors. I find this tends to make it more likely a stock is overlooked. For instance, in the movie industry – investors would focus immediately on the theater owner, the studio producing the film they’re watching, etc. and less on the companies that make the theater’s sound systems, digital projectors, etc. or provide the ticketing kiosks or run the theater’s loyalty program.

In this way, IEH Corporation could be something like George Risk (RSKIA) – a company that has a market cap of under $50 million, is about half owned by insiders (so, the …

Read more
JakeCompounder March 18, 2019

Inspira Financial (LND.V): Liquidation of Business Provides Low Risk Opportunity

*I own shares in this company, and it is a very illiquid stock

Inspira Financial trades under the ticker LND.V on the TSX Venture exchange in Canada, and trades OTC under the ticker LNDZF in the US. While the stock has more volume in Canada, LNDZF is very illiquid. For most of my purchases of LNDZF, my trades accounted for the entire trading volume that day of the stock.

Inspira Financial is selling for about $4.8 million USD, or $6.4 million CAD. The company reports in Canadian dollars, so for simplicity the rest of the information I write will be in CAD. This is a small business that used to lend money to medical offices. They also operate a small billing subsidiary. Management decided to get out of the lending business, so they are collecting on their loans and liquidating that business. They also put their billing subsidiary up for sale as well. This is a weird situation since the stock is basically in liquidation. I think the stock will either be bought out, or the company will use all the cash generated from the liquidation to acquire a new business.

The company is selling below the value of its cash in the bank minus all liabilities. The whole company is selling for $6.4 million, which is 30% below their $9.2 million in cash. Their total liabilities are $1.7 million, which is mostly made up of a provision for legal matters related to a billing competitor. Their other assets, not counting cash, come to $4 million. So let’s assume either their other assets can only be liquidated for less than half of their book value, or that the legal matter is understated, and they cancel each other out. That would still leave us with a company selling 30% below the level of cash in the bank. These other assets of $4 million are made up of $3.7 million of receivables and deposits, while the remainder is equipment. I think it would be conservative to assume the other assets offset the company’s total liabilities.

Inspira also has a billing subsidiary called Inspira Saas Billing Services that they are looking to sell. I am skeptical about this billing business, as I get the feeling they use Saas as a trendy buzzword. This business generated sales of $1.8 million in 2017, and has been growing slightly over the past year. If you extrapolate their latest quarter, the business would have $2.3 million of annualized sales. Last quarter, they reported that they only have two customers within this business, and that one customer makes up over 90% of sales. This quarter, they added 3 new customers bringing the total to 5. However, the main customer still makes up over 90% of sales. Total billing revenues did increase 5% in the quarter, but this is still a tiny business. I’m not sure what this business is worth, but if they could sell it for half of its level of sales, that would be $1.15 million.

Read more
Geoff Gannon March 14, 2019

PRAP Japan (2449): Japan’s Healthiest Public Relations Firm – Trading At Just 4 Times EBIT

This article originally appeared on Kenkyo Investing, a value-driven service specializing in Japanese small and microcap stocks. Each month, Geoff will pick his favorite article from Kenkyo Investing and share it with you here at Focused Compounding. To read all of Kenkyo Investing’s articles, visit Kenkyo Investing’s website and become a member. Don’t forget to use discount code “FCPODCAST” to get 10% off.


Write-up By Kenkyo Investing

Thinking Points

  • PRAP Japan (TSE: 2449) is Japan’s fourth largest public relations consulting firm offering marketing communications, corporate branding, crisis communications, event management, and content production services to corporate customers in a variety of industries.
  • Compared to its competitors, PRAP has the healthiest balance sheet and has delivered business performance at a consistently elevated level.
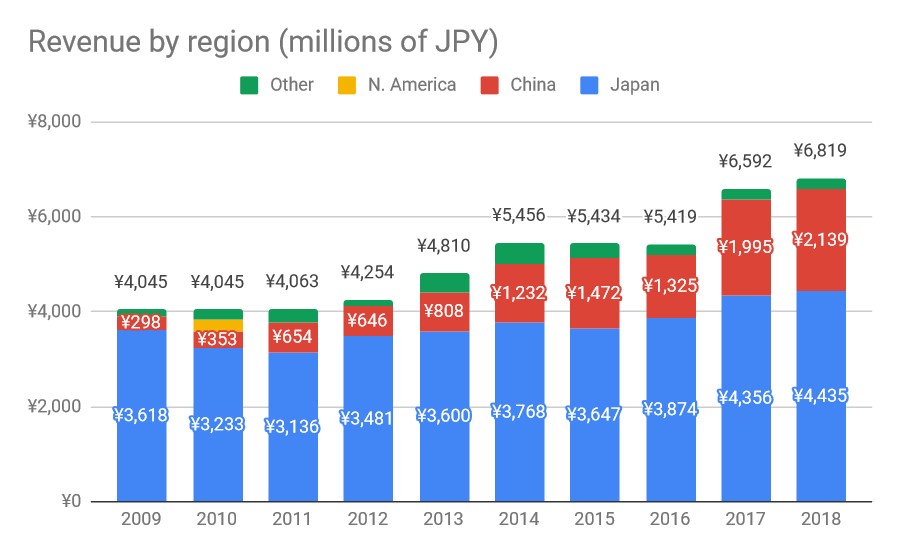
  • Over the last decade, the company built its China business, which now accounts for nearly a third of consolidated 2018 revenues. Meanwhile, its Japan business has remained mostly stable, with modest growth. PRAP plans to expand in the Asia Pacific region going forward.
  • Despite its consistently strong business performance and industry-leading balance sheet health, PRAP trades at an adjusted 4.3 EV/EBIT, considerably lower than its peers, which trade between 9.7x and 25x.
  • Though there is no clear catalyst in sight, if investor sentiment shifts and PRAP trades at comparable multiples, investors can expect a three year investment CAGR of 21% with minimal business risk investing at today’s 1,599 yen per share price.

Introduction

PRAP Japan (TSE: 2449) is a public relations (PR) consulting firm offering marketing communications, corporate branding, crisis communications, event management, and content production services to corporate customers in a variety of industries. Founded in 1970, the company is among the older and established PR firms in Japan. Over the past decade, PRAP has increased its efforts in China, mainly targeting Japanese companies wanting to establish a presence in China.

Source: Company filings


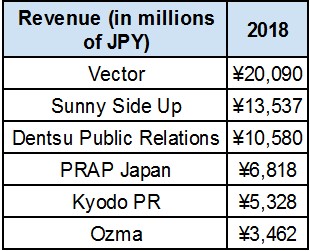
Though PRAP offers a variety of services, it is a single segment company. As of 2018, PRAP is the 4th largest PR firm in the country by revenues.


The business & environment

The Public Relations Society of Japan (PRSJ) estimates that the PR industry size in Japan was 101.6 billion yen ($90 million USD) in 2016 (Japanese). Long term historical data isn’t available for the industry as it is still small. That said, PRSJ notes that the industry is rapidly growing:

Source: Public Relations Society of Japan


Over the last 8 years, the Japanese PR industry has grown at a 4% CAGR. In the last couple years, newswire services and video production and promotion services have fared particularly strong. The key players in the PR industry are:

Source: Company websites


Vector (TSE: 6058), Sunny Side Up (TSE: 2180), PRAP Japan, and Kyodo PR (TSE: 2436) are publicly traded. Dentsu Public Relations is under Dentsu (TSE: 4324), Japan’s largest advertising agency, and Ozma is affiliated with Hakuhodo (TSE: 2433), Japan’s second largest advertising agency.

Although Japan’s PR industry has been growing quickly, PRAP’s revenue growth pales …

Read more
Geoff Gannon March 4, 2019

Universal Robina: A Good, Growing Filipino Branded Food and Drink Business – That’s Not Quite Cheap Enough for Value Investors

Write-up by Jayden Preston


Overview

Founded by John Gokongwei Jr., Universal Robina Corp. (URC) has come a long way since its humble inception as a corn starch manufacturer in 1954. Through decades of diversification, URC is now a leading producer of branded snacks and beverages in the Philippines. To a certain extent, URC is like a mixture of Pepsi Co. and Mondelez in Southeast Asia. While URC does not have a cola product, the Company, similar to Pepsi Co., does have a diverse portfolio of snacks, including potato chips and cheese rings, and beverages, such as bottled water and other ready-to-drink (RTD) beverages. URC also competes with Mondelez in the confectionery business through its products of cookies and chocolates.

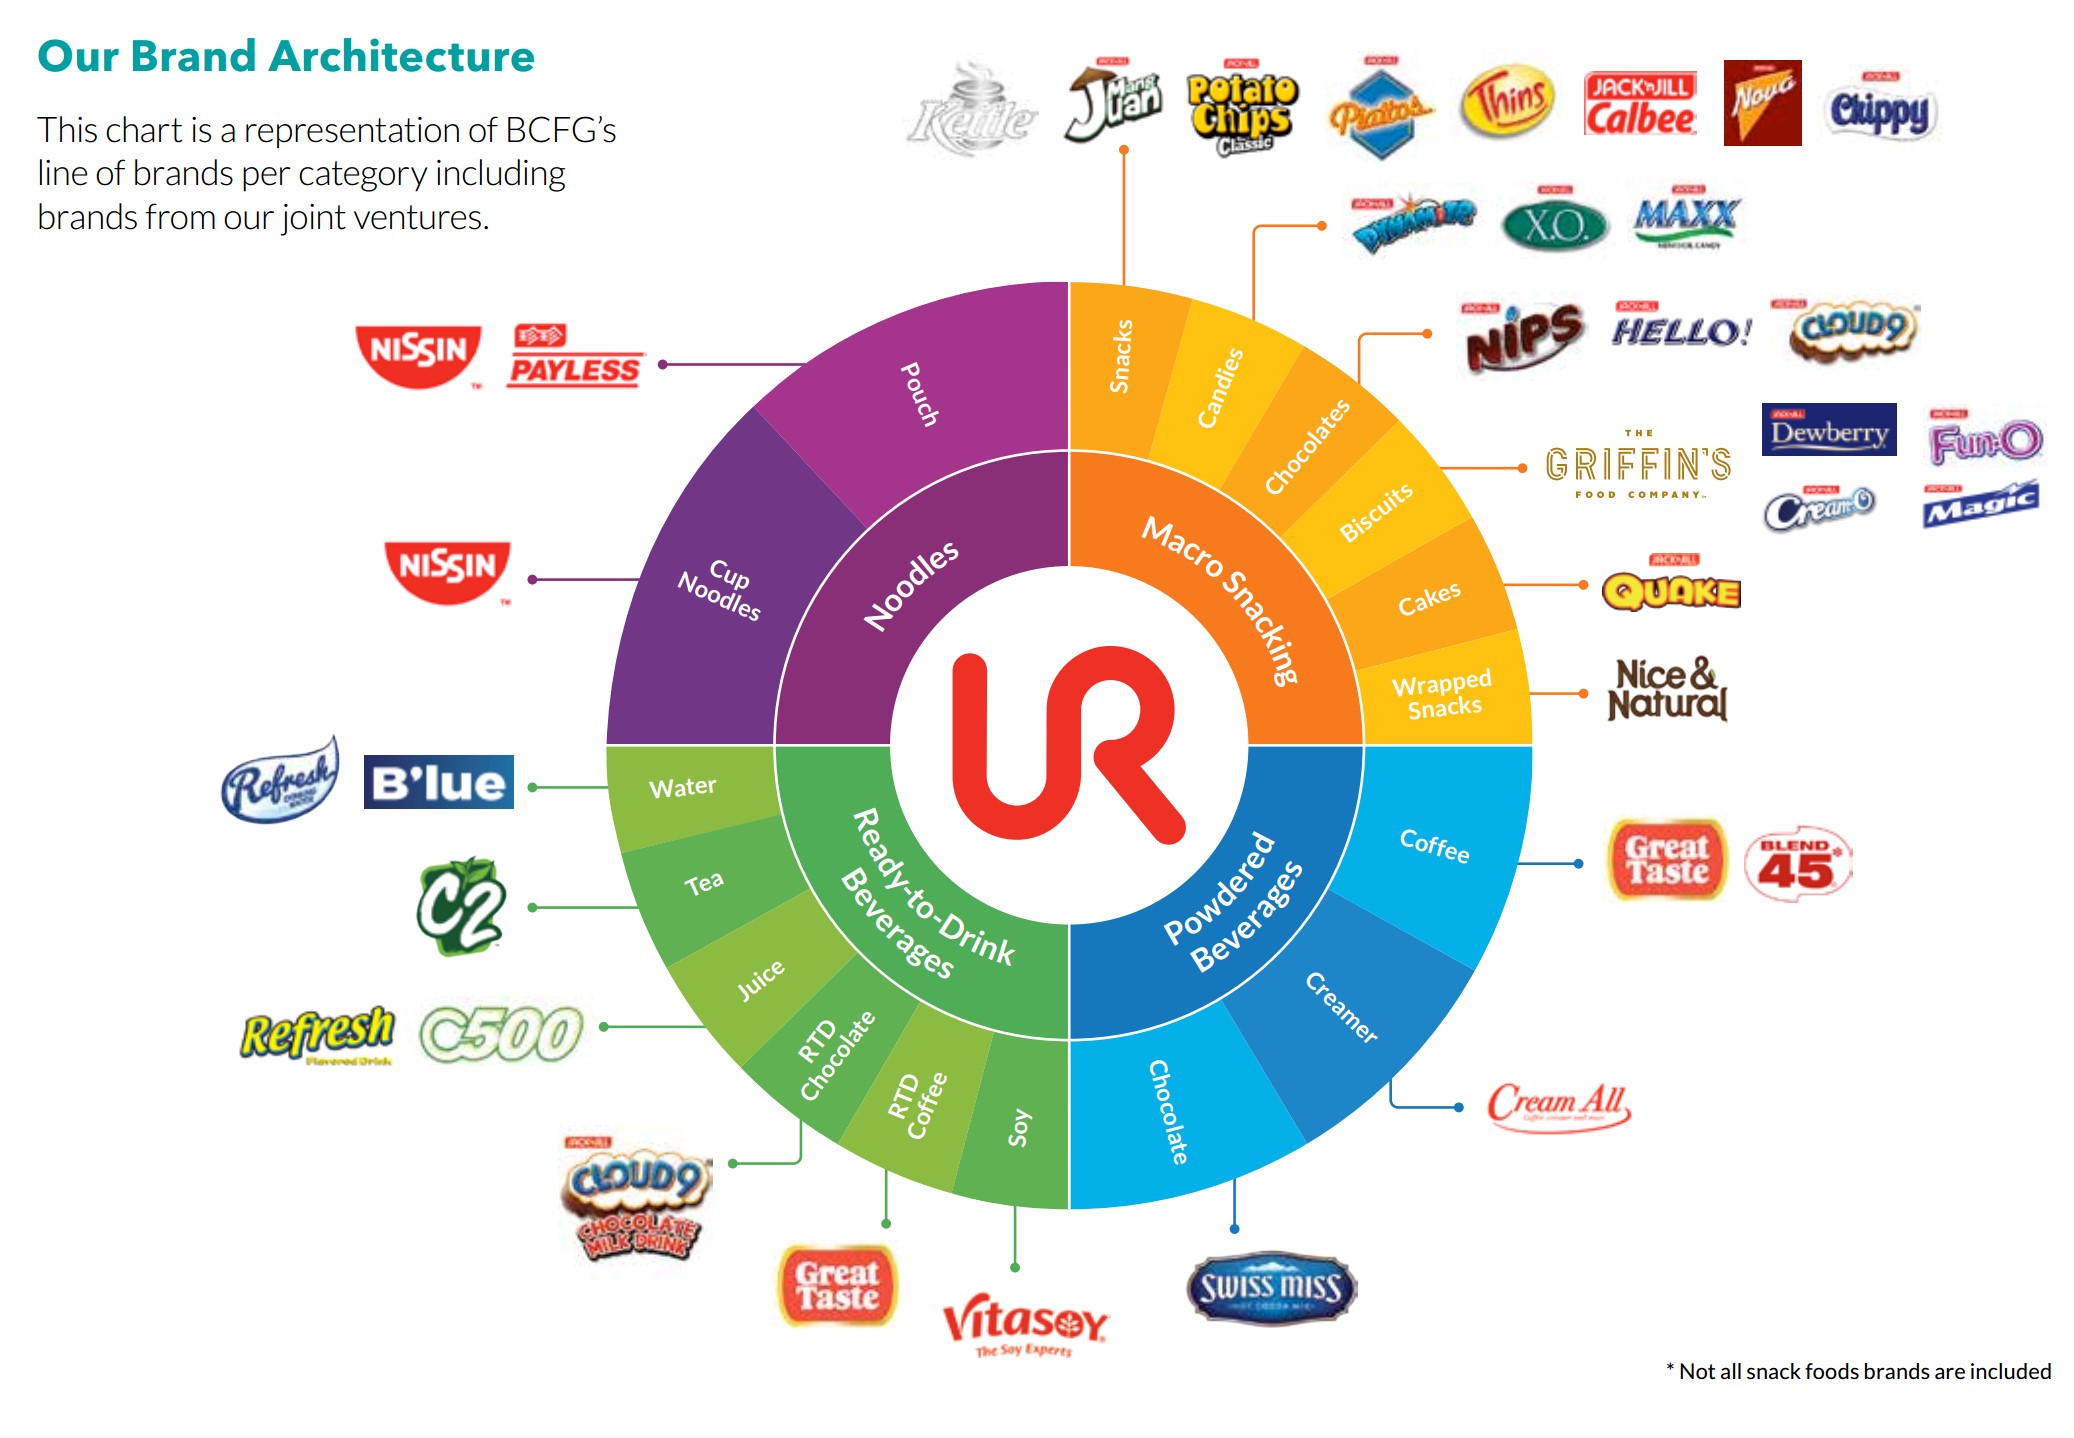
In addition to its home market, URC also has presence in 12 other countries in Southeast Asia and Oceania. Its major international markets include Vietnam, Thailand, Indonesia, Australia and New Zealand.


However, URC is more than just a branded food producer. In the Philippines, URC has two other segments, Argo-Industrial Group and Commodity Foods Group. The former is engaged in hog and poultry farming, while the latter involves flour and sugar milling. This part of the business is similar to Seaboard Corporation.


URC is thus divided into 4 segments: 1) Branded Consumer Food Philippines (CF Philippines), 2) Branded Consumer Food International (CF International), 3) Argo-Industrial Group (AIG), and 4) Commodity Foods Group (CFG). (3 and 4 are collectively known as the Non-Branded consumer food segment. We will refer it as the Non-Branded segment, even though there are still some branded offerings within this segment.)


Segment Breakdown

CF Philippines is the most important segment for URC. It contributed 48% of revenue and 53% of EBIT in 2017. It is followed by CF International in terms of revenue contribution at 34%. Yet, the international segment actually has the lowest margins among all the segments. As such, only 19% of EBIT comes from this segment. In other words, while the Non-Branded segment only generated 18% of total revenue, it was responsible for 28% of EBIT.


In summary, in terms of operating profits, URC is roughly 3 quarters a branded consumer food company spanning in Southeast Asia and a quarter of a commodity foods producer in the Philippines.


Durability and Quality


Branded Consumer Food Segment

Branded snacks and beverages, with brand heritage, tend to score very highly on the scale of durability. The keys to the business are brand recognition and shelf-space availability. The more well-known your brands are, the more willing retailers are to stock your products; and, the more available your products are, the more frequent customers will come across your products. There is thus a reinforcing element in the equation that favors incumbent players.

This is not to say that there is no threat from new entrants. A major concern to the durability of well-established players in this space is the ongoing change in customer behavior, such as the trend toward healthy foods, …

Read more
Geoff Gannon February 25, 2019

BWX Technologies (BWXT): A Leveraged, Speculative, and Expensive Growth Stock that Might be Worth It

BWX Technologies (BWXT) has been at the top of my research pipeline for a while now. I wrote about the company – when it was the combined company that is now split into BWXT and Babcock & Wilcox Enterprises (BW) – a few years back. You can read my report on the combined Babcock & Wilcox in the Singular Diligence archives. Today, I’m not going to talk about the business – which is described in great detail in that report (see the “Stocks A-Z” tab). Instead, I’m going to talk about price.

I’ve talked before about how I need to check off 4 points about a stock. One: do I understand it? Two: is it safe? Three: is it good? And four: is it cheap? If a stock clearly and definitively fails any of these 4 criteria – it’s not something I’m going to want to buy. Since I wrote a report on Babcock a few years back – and since BWXT is the part of the old, combined Babcock I felt I understood best – I definitely think BWXT is something I can understand. I also think it’s a high enough quality business. The big concern with safety is debt. The company does not have an investment grade credit rating. However, the business itself is very safe and very predictable. So, analyzing the debt load is really just a matter of arithmetic. You can judge that part as well as I can. The more interesting question is price. On the surface, BWXT does not look cheap. It has almost never looked cheap. And so: the quickest way to disqualify this stock would be to show that it is, in fact, too expensive to consider at $53 a share.

BWXT had a missile tube issue last year. The stock price declined. And it hit a low around the start of this year. The stock has since rebounded though. We can look at the year-to-date return in the stock as an indicator of how much more expensive it’s gotten. The stock started 2019 around $39 a share. As I write this, BWXT is at $53 a share. So, it’s 36% more expensive. Obviously, the market as a whole has done well in January and February. But, it hasn’t done anywhere near as well as that. So, we’re talking about a substantial rebound in the stock price here. I had put BWXT on my research pipeline before that rebound. So, the question is: at $53 a share, is BWXT too expensive for a value investor to even consider?

The company has debt. And, normally, I’d start with an enterprise value based price metric (like EV/EBITDA or Enterprise Value / Free Cash Flow). However, I’m trying to eliminate BWXT from consideration here. I strongly believe the business is a good, safe (when debt is kept manageable), predictable business. It might be worth a very high multiple of EBITDA, free cash flow, etc. So, starting with something like EV/EBITDA might give us an inconclusive …

Read more
Geoff Gannon January 26, 2019

Resideo Technologies (REZI): A Somewhat Cheap, But Also Somewhat Unsafe Spin-off from Honeywell

This is a revisit of Resideo Technologies (REZI). My initial write-up of Resideo was done before the stock was spun off from Honeywell. Three things have changed since that initial interest post.

One: Honeywell spun-off Resideo. So, we now have a price on Resideo.

Two: I’ve created a five part scoring system – a checklist of sorts – for the stocks I write up here at Focused Compounding. This helps me more systematically order what stocks I should be writing up for the first time, re-visiting, etc. and what stock ideas I should make less of a priority. I’ll score Resideo using this 5-point checklist later in this article.

Three: Resideo released its first quarterly earnings as a public company. Management hosted an earnings call where they took analyst questions. They put out some earnings slides with that call as well. So, we have a bit of an update since last time.

I can tell you now that this third event is the least interesting. It’s the one I’ll spend the least time talking about. What matters most here is that we now have a price on Resideo stock and I can now score Resideo on my 5-point checklist. Let’s start with the checklist.

The 5 questions I’ll be asking are:

1)      Is Resideo stock overlooked?

2)      Do I understand the business?

3)      Is this a safe stock?

4)      Is this a good business?

5)      Is this a cheap stock?

I score each question on a scale that goes: -1 (“no), 0 (“maybe”), +1 (“yes”).

Is Resideo stock overlooked? – Maybe (0). The answer can’t be a straight “no”, because this is a spin-off. Spin-offs, in general, lead to stocks being overlooked – at least at first – because shareholders of the bigger company (in this case, the very big company Honeywell) get shares in this much smaller company without doing anything. They may sell the stock without giving it a lot of thought. Also, this spin-off didn’t seem to be a huge focus for value investors and what I did read online from value investors often treated it as something of a throwaway by Honeywell. Basically, not a lot of people are writing about how this is a high quality business. They are writing about how this company is slow growing, fully mature, and includes the burden of paying Honeywell indefinitely to cover environmental liabilities. So, this isn’t a particularly focused on spin-off. But, it’s still a stock with a market cap over $2 billion. It’s listed on a major exchange. It did an earnings call with analysts. I didn’t hear questions from analysts at especially big firms. This is probably a pretty overlooked stock for a $2 billion to $3 billion market cap. But, in the world of the kind of stocks I often look at – it wouldn’t count as overlooked at all. I’ll split the difference and say Resideo “maybe” overlooked (0 points).

Do I understand the business? – Yes (+1). I owned a stock –

Read more
Geoff Gannon January 18, 2019

Vertu Motors: A Cheap and Safe U.K. Car Dealer

Vertu Motors owns more than a hundred car dealerships in the United Kingdom. About half of the time – so, at 50+ locations – Vertu Motors also owns the land on which the dealership is built. They lease the other half of their locations. The stock trades on the London Stock Exchange (the AIM market, specifically) under the ticker “VTU”.

Back on November 14th, 2017 Focused Compounding member Kevin Wilde sort of wrote up Vertu Motors. He did an idea exchange post on U.K. car dealers. The stock he focused most on was Vertu Motors.

Why?

Why focus on Vertu Motors specifically?

And why focus on U.K. car dealers generally?

Publicly traded U.K. car dealers seem to trade at lower prices than their U.S. peers. In the U.S., car dealerships are usually sold at a premium to tangible book value. Car dealer stocks tend to trade at a premium to tangible book value. In the U.K., some publicly traded car dealers – like Vertu Motors – have shares that can be bought below tangible book value.

We can try to come up with arguments for why U.S. car dealers should be more expensive than U.K. car dealers. But, the math isn’t very convincing. For example, if we look at the rate of growth in Vertu Motors’ tangible net assets per share over the last 5 years – it isn’t lower than what U.S. car dealers would be able to achieve. At times, Vertu Motors stock has grown net tangible assets per share by 10% or more a year while also paying a dividend. The company was not very successful growing PER SHARE asset values in the years immediately after its founding (though it did increase the size of the company and improve its economics during this time). Since scaling up, the company seems capable of getting a 10% growth rate in net tangible assets without using leverage. Car dealers often use some leverage. And – as I said earlier – Vertu Motors stock can sometimes be bought below its tangible net assets. The company’s management includes their own 10-year calculation of free cash flow generated versus assets employed and comes up with a number around 10% a year. If I take the most recent half of the company’s existence and use the rate of compounding in net assets per share (instead of FCF like the company uses) I’d get a similar rate of value creation. Basically, I’m going to assume here that Vertu Motors can generate about 10% worth of “owner earnings” relative to its net tangible assets.

We can use that information to answer the question: “Is it cheap?”

When first looking at a stock, I often ask 5 questions: 1) Is this stock overlooked? 2) Can I understand this business? 3) Is the business safe? 4) Is the business good? 5) Is the stock cheap?

Because I started today’s discussion with the company’s ability to generate earnings relative to tangible equity – let’s start …

Read more
Geoff Gannon January 7, 2019

Green Brick Partners (GRBK): A Cheap, Complicated Homebuilder Focused on Dallas and Atlanta

I chose to write-up Green Brick Partners (GRBK) this week for a couple reasons. The first is the company’s headquarters: Plano, Texas. I live in Plano. And the company gets about half of its value from its Dallas-Fort Worth homebuilding operations. My “initial interest post” checklist goes something like this:

  • Do I understand the business?
  • Is it safe?
  • Is it good?
  • Is it cheap?

The single most important questions is number zero: “Do I understand the business?” Since I’ve lived for about seven years right by this company’s lots – I should understand it better than most homebuilders. The other half of the company, however, is in the Atlanta area. That is a place I know nothing about. So, the answer to question zero would be that I understand half the business here well.

The next easiest question to answer – after “do I understand the business?” – would be #3 “is it cheap?”.

So, we’ll skip right to that one. It is, after all, the other reason that put Green Brick Partners at the top of my research pipeline.

I have in front of me the balance sheet for Green Brick Partners dated September 30th, 2018. This is the last day of the most recent quarter the company has provided results for. Under “inventory” we see $648 million. Under “cash” we have $33 million. There’s another $12 million under “restricted cash”. The unrestricted part of cash is offset almost exactly with customer deposits. The restricted part of cash is just $12 million. Debt is about $200 million gross. So, that leaves about $188 million in net debt. If we netted out that inventory less that net debt we’d be left with $648 million in inventory less $188 million in net debt equals $460 million. The company has a little less than 51 million shares outstanding. So, $460 million in real estate free from debt divided by 51 million shares outstanding equals $9.02 a share. Let’s call that $9 a share. That’s very close to the company’s officially stated net tangible book value of $8.97 a share. Again, that’s basically $9 a share. We can compare this to the market price of $8.06 a share at which GRBK stock closed today. So, we have a stock with tangible book value – almost all land (about 50% in Dallas Fort-Worth and about 50% in the Atlanta area) – of $9 a share against a market price of $8 a share. Green Brick Partners is trading at about 90% of book value. So, a price-to-tangible-book ratio of 0.9 looks cheap.

However, this is where we start getting into the more complex aspects of Green Brick Partners. The company’s balance sheet shows only $15 million (about 29 cents a share) in “noncontrolling” interests. Green Brick, however, has only a 50% economic interest in its Dallas Fort-Worth and Atlanta homebuilders. The fair market value of the 50% owned by its partners – basically, the top management of these “controlled builders” – would …

Read more
Skip to toolbar