Posts By: Geoff Gannon

Geoff Gannon May 27, 2019

Parkit Enterprise: Activist Controlled Parking Lot Owner Looking to Monetize Holdings, Trading at a Discount to Net Asset Value

WRITE-UP BY THOMAS NIEL

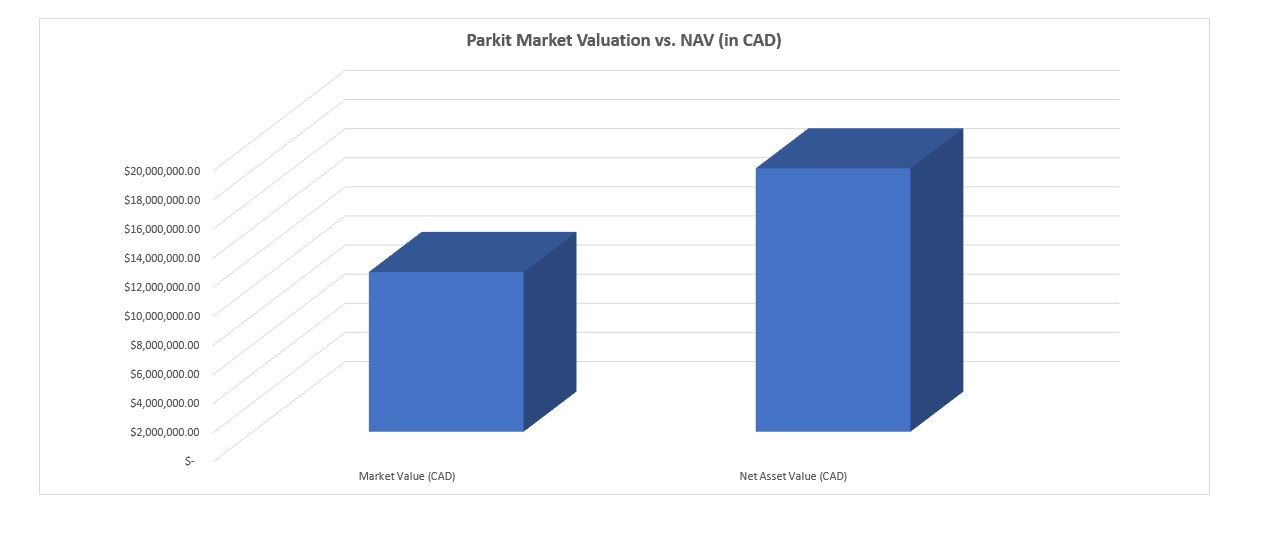
(Image Created by the Author; Data via Parkit Investor Relations Page and Author’s Calculations)


Parkit Enterprise is a Canadian-domiciled owner of parking lots in the United States.

Investors have forgotten about Parkit, pushing the stock to trade well below its underlying value.


But one investor saw opportunity and has taken the reins to realize the company’s underlying value. Leonite Capital, a family office led by Avi Geller, has acquired a large position, and last year took control of the board.


Following this proxy-fight win, Leonite is looking to extract full value out of the company. But can they achieve what its prior management presumably failed to accomplish? Will realization of full value occur within an attractive timeframe (2-3 years?).


Let’s take at Parkit and see if the current discount to NAV is justified or presents a strong investment opportunity.


Background


Parkit Enterprise, Inc. (TSX.V: PKT; OTCQX: PKTEF) is a Canadian-domiciled owner of parking lots in Colorado, Connecticut, and Tennessee. The stock trades on the Toronto Venture Exchange, as well on the US OTC markets.


Parkit started out as Greenscape Capital Group, a holding company engaged in various “green”-related businesses. After developing the Canopy Airport parking facility, the company decided to sell off its non-core holdings and focus entirely on parking.


The company renamed itself Parkit Enterprise in 2013. Starting in the mid 2010s, Parkit formed a partnership with parking lot management company Propark America to acquire additional properties.


This resulted in Parkit becoming a major investor in two partnerships:


  • OP Holdings JV, LLC. This partnership was formed in 2015 with Och-Ziff Real Estate as the primary investor. In 2015, OP acquired Parkit’s Colorado property, as well as properties in California, Connecticut, and Florida.
  • PAVe Nashville, LLC. a 50/50 partnership with Propark. This vehicle acquired an airport parking facility in Nashville, TN in 2015.


This opaque ownership structure is part of the reason why investors have overlooked Parkit. Like with other similar vehicles (such as Regency Affiliates), there is the added risk of being a “passive investor in a passive investment”.

OP Holdings JV

The bulk of Parkit’s investments are held through OP Holdings JV, a partnership with Och-Ziff Real Estate and Propark formed in 2015.


Parkit owns an 82.83% interest in Parking Acquisition Ventures, LLC (PAVe). Due to the success of two divestitures, Parkit has fulfilled the 15% IRR hurdle due to Och-Ziff. As per the terms of the operating agreement, proceeds from asset sales will now begin to flow to PAVe.


As per the operating agreement, PAVe is now entitled to distributions until it realizes a 15% IRR on its initial capital contributions.


Through OP, Parkit holds interests in 4 properties:


  • Canopy Airport Parking Facility (nearby Denver International Airport)
  • Riccio Lot Hospital Parking (New Haven, CT)
  • Chapel Square Lot (New Haven, CT)
  • Z-Parking (East Granby, CT)


Canopy Airport Parking Facility

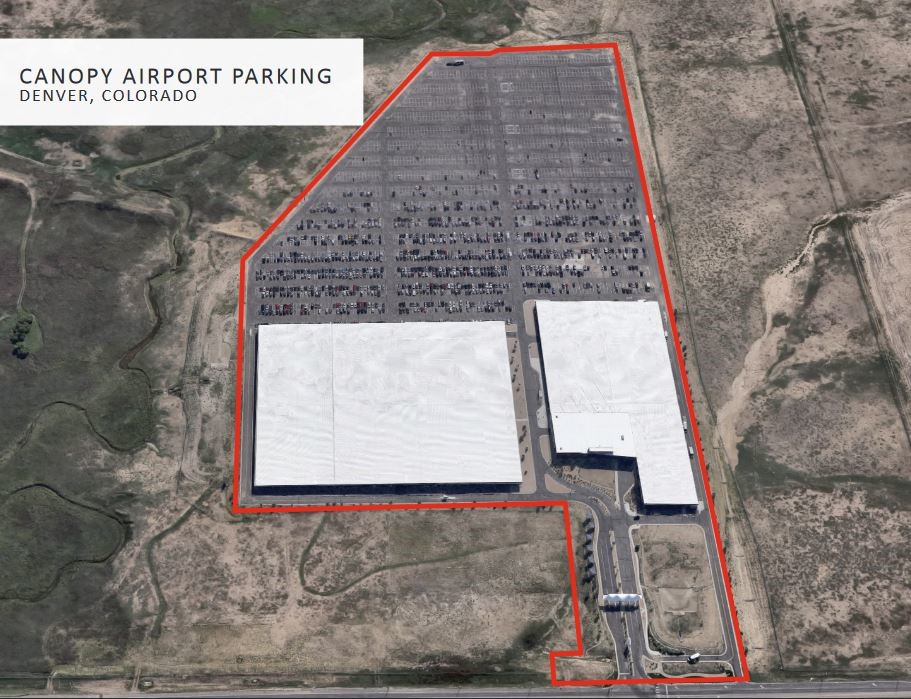
(Source: Parkit Investor Presentation, April …

Read more
Geoff Gannon May 19, 2019

Nuvera Communications (NUVR): A Microcap Telecom Company in Rural Minnesota With Stable Earnings and Effective Management That Is Trading At A Cheap Price to Free Cash Flow

Write-up by Carleton Hanson

Investment Thesis Summary

Nuvera Communications (NUVR) is a micro-cap regional telecommunications company that operates primarily in south-central Minnesota. The company has a long history of operating profitably and growing revenues with timely acquisitions, yet due to its small market cap, OTCPK listing, and limited share liquidity NUVR is trading at very reasonable levels. NUVR’s market cap currently sits at about $100 million, with $8 million in net income in 2018 and $10 million in free cash flow. During 2018, NUVR was able to simultaneously grow revenue 20% YoY and begin integrating a major new acquisition, Scott-Rice Telephone Company. The company also benefits from federal programs that pay telecom providers to install fiber data connections in rural and under-served areas. These incentives are guaranteed for 10-year periods and the terms have become even more favorable recently, with payments to NUVR from these programs rising 10% YoY in 2019. The full effects of the Scott-Rice acquisition and increased federal subsidies are becoming clearer as the company moves into 2019, with NUVR generating just over $4 million in FCF in Q1, putting it on track for a 14-16% FCF yield for the year. For reasons I will discuss, I don’t believe the market is keeping pace with the increased value of NUVR’s business and I think an opportunity exists to establish a long-term position in the company at these levels.

For me to get excited about establishing a long-term position in a company, there are a number of things that I look for. First, I want to make sure that the company has stable earnings and cash flow, which indicates that the core business model is healthy. I also want to make sure that the management is trustworthy and effective and that I feel comfortable investing with them for an extended period of time. Ideally, I would also like to see that the company has avenues to grow the underlying business, and if I can get this growth paired with stability at a reasonably cheap price I am comfortable establishing a position. I believe that NUVR meets all of these criteria and is worthy of investment consideration.

NUVR is Stable

One of the major appeals of NUVR is the stability of its core business. At the most basic level, NUVR provides phone, video, and internet service to its customers for recurring monthly fees. NUVR is responsible for keeping up the maintenance of their infrastructure and providing customer support, but if they can do that the company gets the benefit of steady cash flow coming in every month as customers pay their bills. As a value-add for customers, the fact that NUVR has voice, video, and data/internet options allows customers to bundle their telecom products together into one monthly bill, giving them one point of contact when they need support and a discount from NUVR for using multiple services. While there is competition from other companies offering individual services, few offer bundled services to their customers, making NUVR …

Read more
Geoff Gannon May 19, 2019

DPI Holdings Berhad (KLSE:DPI): A Tiny Developing Market Aerosol Paint Manufacturer/Distributor with 16%+ Operating Margins, Wholesale Pricing Power and 12 to 15 Years of Growth Capex in the Bank

Write-up by Warwick Bagnall

DPI is a Malaysian manufacturer/distributor of aerosol paint and paint solvents.  It’s listed on the ACE market, a secondary board of Bursa Malaysia.  It listed in early 2019 and was heavily oversubscribed so it’s not exactly overlooked.  Market cap is around MYR 85 MM (one USD is a little over four MYR at the time of writing) so it is a microcap.  Normally I wouldn’t bother to look at a recent IPO but two things made me take a closer look – I think consumer paint businesses have significant pricing power and DPI reports margins that are higher than most paint businesses.  It doesn’t hurt that the share price is well below the IPO price of MYR 0.25.


The company segments total revenue into three product categories – aerosol paint (73%), industrial aerosols (8%) and solvents (19%).  It sells these products through three channels – 70 distributors within Malaysia, via DPI-owned distributor DPIC which has 630 sub-distributor and reseller customers within Malaysia and to eight private label customers, six of which are located outside Malaysia. Most of DPI’s business is in Malaysia but it has recently indicated that it intends to enter the Myanmar and Vietnamese markets.


Aerosol paint manufacture is not high-tech and for a manufacturing business it doesn’t require much capital.  I estimate you could set up a factory like DPI’s replacement cost of MYR 20 MM in the same location with similar input costs and start trying to sell to Malaysian distributors within 12 months.  You could also import similar products from suppliers in China, duty free and with a freight cost that would detract from your margin but not prevent you from making a decent profit at the same price DPI sells for.  At the very least, one of the other multinationals with factories in Malaysia such as Nippon Paints should have competed DPI’s margins away long ago.  But that hasn’t happened – DPI made an operating margin of 16 to 25% between 2016 and 2018.


Paint businesses such as Sherwin-Williams (NYSE:SHW) and RPM (NYSE:RPM) are generally known for having pricing power and steady operating margins in the low teens.  But DPI’s is exceptional.  I can find only one other paint businesses with similar profitability to DPI – Samurai 2K (SGX:13C) which is a direct competitor to DPI.  I don’t think this is a coincidence.


To value DPI at anything higher than liquidation value requires three things:

  • Confidence that they can maintain market share and pricing power in Malaysia.
  • Confidence that management and competitors won’t attempt to grow market share by cutting prices.
  • Willingness to substitute transparent unit economics for a long term history of profitability under public ownership. The company has been listed less than one year.

I’m going to focus on the aerosol segment of DPI’s business.  DPI sells solvent at a gross margin around 3%.  There don’t appear to be any synergies between the solvent and aerosol businesses – DPI’s competitor achieves similar or better …

Read more
Geoff Gannon May 12, 2019

GAP Inc. (GPS): A Market Leader in Apparel Retail Is Spinning Off Underperforming Assets Which Should Drive Shareholder Value, But Income Derived From a Third-Party Credit Card Agreement Overstates The Company’s Earning Power And Makes the Stock Too Risky

Write-Up by Jonathan Danielson

Gap Inc. (GPS) is a company everyone should be familiar with: they’re an apparel retailer that specializes in ‘casual classics’. Meaning, jeans, khakis, polos, button downs, etc. The Company is headquartered in San Francisco and was founded in 1969. Gap Inc. has acquired and launched several brands over the years, but its main ones currently are: Old Navy, Gap Brand, Banana Republic, Intermix, and Athleta. GPS has increasingly become an Old Navy company over the years as consumers have flocked towards value brands and have deserted higher end specialty brands so it wasn’t too terribly surprising when they announced at the end of last quarter their intentions of separating into two companies. Interestingly enough, Old Navy will be the RemainingCo operating as a stand-alone business while Gap Brand, Banana Republic, Athleta, and Intermix will be spun off.


Based on consolidated metrics, GPS appears to be an interesting situation. When I pull the company up on QuickFS.net I see a company that has 10 year averages of:


  • Gross margins: 38%
  • EBIT margins: 11%
  • ROE: 29%
  • ROIC: 34%


All for a P/E of 10 and an EV/EBITDA of 6-ish. Not bad for a retailer. In fact, I was expecting much, much worse. If you pull almost any of their peers up and measure them on the same metrics you get an entirely different picture. More specifically, I looked at Guess, American Eagle, and Abercrombie and Fitch. Let’s just say when you pull those company’s financials up it looks like they have been existing in an era where questions are being raised about the viability of the brick and mortar retail business models. So, perhaps there’s an interesting situation here after all. Gap Inc. only grew revenue at a 1.8% CAGR over the past 10 years. However these are consolidated numbers and Old Navy is being spun off, remember? And Old Navy has been growing faster than the rest of Gap. Inc’s brands. Additionally, the “peers” I listed above most likely aren’t peers – not for Old Navy at least. The companies I previously listed are closer to Gap Brand and Banana Republic. The closest peer for Old Navy is probably somewhere in between Ross and H&M. Ross has been able to maintain healthy margins and growth while it appears H&M has struggled of late. Nonetheless, both companies look much healthier than any of the specialty-type brands previously listed.


We might have a compelling thesis on our hands if Old Navy is all that management cracks it up to be. The answer, as typically the case, isn’t so clear as one would hope. After all, GPS is operating in an environment that’s been dubbed the retail apocalypse. We’re living in the age of Amazon, how is your classical brick and mortar retailer churning out 34% returns on capital? Is Old Navy really that good? Well, I have my suspicions that it might not be the case. I’ll walk you through the numbers, show you how …

Read more
Geoff Gannon April 29, 2019

VieMed Healthcare (VMD): A Founder Led Canadian Listed U.S. Ventilator Company Faces the Risk of Competitive Bidding for its Medicare Patients Starting in 2021

Write-up by REID HUDSON


(Geoff’s note: VieMed trades under the symbol “VMD” in Canada and over-the-counter in the U.S. under the symbol “VIEMF”. The stock is a lot more liquid in Canada than in the U.S. However, the price difference between the shares in Canada and the U.S. doesn’t always perfectly reflect the U.S. Dollar to Canadian Dollar exchange rate.)


VieMed Healthcare Inc. operates in the home health space and provides services and equipment to a variety of respiratory patients.  Its main market consists of stage 4 COPD patients who are in need of non-invasive ventilation (NIV) therapy to continue living without excessive time spent in a hospital.  VieMed also offers a range of sleep apnea, oxygen, and other respiratory solutions to patients.  VieMed employs Respiratory Therapists (RTs) to assist patients with the set-up of machines, education, continued monitoring, and other services included in respiratory treatment.  The company states that NIV treatment makes up roughly 90% of its business.  VieMed is a Canadian listed company that operates in the United States.  Its corporate structure consists of a Canadian parent company listed on the TSX called VieMed Healthcare Inc.  This parent company is the sole owner of a Delaware incorporated U.S. subsidiary called VieMed Inc. that owns two subsidiaries of its own.  The company operates through these two Louisiana based subsidiaries: one called Sleep Management, LLC and the other called Home Sleep Delivered, LLC.

As the graphic above shows, Sleep Management was founded in 2006 by its current CEO Casey Hoyt.  It got into the Non-Invasive Ventilator (NIV) market in 2012 and began to focus on COPD, changing its name to VieMed shortly thereafter.  After being acquired by PHM, VieMed completed a spin-out in 2017.  It was listed on the TSX Venture Exchange mainly because the company that it spun-off from was listed there.

VieMed claims that it cares for more patients with non-invasive ventilators than any other company in the United States.  NIVs are non-invasive machines that are used to lessen the effort required to breath.  They are primarily used by patients with late-stage COPD and neuromuscular diseases that both make it very difficult to breathe without assistance.  These machines are non-invasive as opposed to invasive ventilators that require insertion through the mouth, nose, or directly to the trachea by way of a tracheostomy tube.

Since entering the NIV market, VieMed has grown revenue and active vent patients at a fantastic rate.  Its revenue has grown at a CAGR 44% since 2010 and around 29% since its name change in 2014.  However, this number is weighed down by a negative year in 2016, when Medicare slashed reimbursement rates for NIVs.  Most recently, VieMed grew its top line number 39% in 2018 and around 50% in 2017.  The number of active ventilation patients that it serves grew to about 5,905 in 2018, representing a growth rate of about 35% for the year.  Active vent patients grew at almost 43% in 2017.   While this growth has been impressive, what …

Read more
Geoff Gannon April 28, 2019

Sandridge Energy (SD): A Carl Icahn Controlled Post-Bankruptcy Oil Producer With 10-35 Years of Proved Reserves in Colorado, Oklahoma, and Kansas Trading at a Fraction of Net Asset Value

Write-up by JONATHAN DANIELSON

Sandridge Energy (SD) is an upstream oil and nat gas exploration and production company with operations primarily in the Mid-Continent and North Park Basin in Colorado. The Company is an onshore driller and owns three principle assets: Mississippi Lime, NW STACK, and the North Park Basin. The Miss Lime is a mature asset that will continue to decline in production, while the STACK and N Park assets are newer, higher growth, and more economically attractive.

I believe SD to be one of the most demonstrably mispriced and most compelling E&P play around for a multitude of reasons. SD is not a stock for a concentrated investor and extreme caution in trading the name is urged by your author.

Despite being in a tough industry, there is no reason for this valuation discrepancy and it is very unlikely to persist. SD has cleaned house with a new management team in place which has shed unproductive assets, implemented tighter cost controls and will invest future cash flows into their more productive assets.


Recent Events:

There are several factors at play as to why SD is currently trading so cheaply. For one, it’s a post-bankruptcy stock. With headquarters in Oklahoma City, Sandridge was founded by Tom Ward in 2006. Ward went on to accumulate over $10 billion from Wall Street investors and pursued strategies that entailed growing without regard to the underlying economics of the transaction in question (Empire building), leveraging the balance sheet with billions in debt, and subsequently entering Chapter 11.

SD emerged from bankruptcy in late 2016 and has seen its share price slide ever since. The reasoning reorg stocks face selling pressure is well documented in Greenblatt’s Stock Market Genius book, so i’ll be brief – as former bondholders now become equity holders there’s a mismatch in owners of the capital structure. Entities who specialize in distressed debt now find themselves owning equity, which they likely have very little interest in. Thus, selling pressure ensues.

Second, the past 5 years have been brutal for all E&P companies with the collapse in oil prices. Many of whom have subsequently filed for Chapter 11. That’s what happens when you take a commodity business notorious for cyclicality and add leverage. Upstream producer’s woes were exacerbated in the second half of last year as oil was again hammered.

Third – and most importantly – SD was on the bidding block last year as part of their “strategic review” and bids came significantly lower than what was expected. I believe many special situation-type investors owned SD last year in hopes of participating in a quick asset sale. As these hopes failed to materialize these investors likely dumped their shares in droves, as they were now stuck with a mediocre oil producer at a time when crude was crashing.

These factors have culminated in a stock that I believe is too cheap to ignore.


Overview:

Upstream Oil & Gas producers represent the epitome of high risk business models – hundreds …

Read more
Geoff Gannon April 27, 2019

Garrett Motion (GTX): Messy Financials, A Peculiar Indemnification Liability, & Typical Spin-off Dynamics Have Obfuscated Garrett Motion’s Attractive Underlying Economics

WRITE-UP BY JONATHAN DANIELSON

Overview – Recent Events and Thesis

Garrett Motion (GTX) was spun off of Honeywell in September of last year as part of Honeywell’s ongoing series of divestitures (REZI, GTX, & ASIX). GTX primarily is in the business of designing and manufacturing turbochargers for automotive OEMs. They also design and make E-boosters for hybrid vehicles. As part of the spin-off agreement, Honeywell dumped their Asbestos Indemnification Liabilities on the newly formed entity (approximately $1.4 billion in total liabilities) in addition to loading the newly formed company up with debt that was 3x EBITDA. These dynamics have most likely led the market to view Garrett as a “garbage barge” spin, designed to solely benefit the parent by improving its capital structure and allowing the parent to quietly remove toxic assets off their balance sheet.

Investors in the special situation arena must pay close attention to this possibility, as buying into a garbage barge spin can have devastating results on your portfolio. Nevertheless, assets that the market apparently view as being “garbage”, a closer examination reveals a company that’s an entrenched market leader, possesses a formidably wide moat, earns adequate returns on capital employed, has reasonable growth prospects over the coming years, and is trading at a ludicrous 25% Free Cash Flow yield.

In addition, the Company is inherently highly cash flow generative, with a proven management team in place, and a business model that lends to a good degree of top-line visibility as car/engine designs are started years in advance.


The Company – A Brief History

Founded in the 1930s by Clifford Garrett, GTX was originally an aviation company, supplying the industry with turboprop engines and turbochargers. It wasn’t until the post-war 50s that the Company first started supplying the auto industry with turbos. In 1954 Caterpillar selected Garrett’s T15 turbo for its D9 mining vehicle. Then in the 60s came the Oldsmobile Jetfire Turbo Rocket and the T04 turbo for Deere’s farm tractor. Garrett was gobbled up by Honeywell in the late 1990s and went on to play a significant role in the company’s Transportation Systems segment.

Now, if some of you reading this didn’t grow up with a ‘grease-monkey’ older brother, then you’ll be forgiven for being a bit fuzzy on the specifics the role turbochargers play in enhancing the performance of internal combustion engines. Essentially, in order to increase the power of an engine, you have to pump more air into it (not just more gas). There are really only two ways to do this: by increasing displacement of the engine (which has obvious limitations) or by making the engine more efficient. Here’s a fun video to give you an overview: Turbocharger Basics.

It’s important to note the differences between turbochargers and superchargers as they are very much competing products. The differences between the two products has led to a secular tailwind for the turbocharger market. The way turbochargers increase an engine’s efficiency is by using the engine’s unburned fuel (the exhaust) to …

Read more
Geoff Gannon April 25, 2019

Bonal (BONL): An Extremely Tiny, Extremely Illiquid Stock that Earns a Lot But Doesn’t Grow at All

Bonal isn’t worth my time. It might be worth your time. It depends on the size of your brokerage account and the extent of your patience.

So, why isn’t Bonal worth my time?

I manage accounts that invest in “overlooked” stocks. Bonal is certainly an overlooked stock. It has a market cap under $3 million and a float under $1 million (insiders own the rest of the company). It often trades no shares in a given day. When it does trade, the amounts bought and sold are sometimes in the hundreds of dollars – not the thousands of dollars – for the entire day. It’s also a “dark” stock. It doesn’t file with the SEC. However, it does provide annual reports for the years 2014 through 2018 on the investor relations page of its website. In the past, the stock has also been written up by value investing blogs. Most notable is the write-up by OTC Adventures (the author of that blog runs Alluvial Capital – sort of another “overlooked stock” fund). That post was written back in 2013. So, it includes financial data from 2008-2013. I strongly suggest you read OTC Adventure’s post on Bonal:

Bonal International: Boring Products and Amazing Margins – BONL

The company has also gotten some coverage in a local newspaper. For example, I’ve read articles discussing Bonal’s attempt to sell itself at a below market price. Shareholders rejected this. So, the stock isn’t a complete enigma. You have write-ups like OTC Adventures, you have some old press coverage, and you have annual reports (complete with letters to shareholders) on the company’s investor relations page. At the right price, it’s definitely an analyze-able and presumably invest-able stock.

But, not for me. Because I run managed accounts focused on overlooked stocks, I try never to eliminate a stock simply because it’s very, very small or trades almost no shares on most days. Even stocks that appear to have zero volume are sometimes investable. In my personal experience, I can point to cases where I bought up to 10,000 shares of a stock in a single trade that had a history of trading less than 500 shares on average. And that’s not a one-off fluke. It’s happened to me more than once. So, if the shares are out there – your best bet is to bid for the stock you like best regardless of what the past volume of that stock has been. Often, it may be easier to get into – and even out of a stock – in a few big trades than it appears on the surface. This is due in part to people trading much smaller amounts of the stock than you – and a few other bigger, or simply more concentrated investors – will want.

However, in the case of Bonal – there simply aren’t enough shares held by non-insiders to make it worth my while. The accounts I manage are not big. But, the investment strategy I practice is not one …

Read more
Geoff Gannon March 30, 2019

Revisiting Keweenaw Land Association (KEWL): The Annual Report and the Once Every 3-Year Appraisal of its Timberland Are Out

Accounts I manage hold shares of Keweenaw Land Association (KEWL). I’ve written about it twice before:

Keweenaw Land Association: Buy Timberland at Appraisal Value – Get a Proxy Battle for Free

And

Why I’ve Passed on Keweenaw Land Association – So Far

I didn’t continue to pass on Keweenaw Land Association. Like I said, the stock is now in accounts I manage.

There are really two things worth updating you on. One is the annual report. The other is the appraisal. The appraisal is something the old management team – the one that lost last year’s proxy vote to Cornwall Capital – always did as well.

So, I can show you a summary of every appraisal from 2006 through 2018. The company includes this in its annual report:

You can read the entire annual report here.

A full summary of this year’s appraisal and methods used by the appraiser can be found here.

In today’s article: I’ll focus on the appraisal, because valuation of the stock seems to be the thing readers are most interested in. The annual report is also quite interesting though. The company’s new management is disclosing far more than the previous management. Although Keweenaw stock is “dark” (it doesn’t file with the SEC) – this latest annual report reads like a typical 10-K filed with the SEC. The company also changed its auditor to a better known firm (Grant Thornton) that audits plenty of other public companies.

As you can see in the table above, the value per acre of KEWL’s timberland was appraised at $809 this year versus $901 in 2015. That’s a decline of 10% versus 3 years ago. It’s also basically flat with an appraisal done in 2009 (so nearly 10 years ago). These are also nominal numbers. So, that means that the real value of KEWL has declined on a per acre basis over the last decade.

What’s tricky about this though is the last row you see “appraisal as a percent of standing inventory”. As you can see, the effective gross timber value – this is the value of all of the wood on Keweenaw’s land less the estimated gross costs of cutting and trucking that timber away – has risen pretty consistently. It went from $728 an acre in 2009 to $1,130 an acre today. But, the appraisal as a percent of that standing inventory went from 110% in 2009 – meaning the appraiser was then valuing the timberland above the gross value of the timber itself – down to just 72% this year. You can also see that the physical volume of timber – measured in cord equivalents – has compounded at something like 4% a year over the last 12 years. So, physically there is more timber on Keweenaw’s land every 3 years – and at least in the 2012, 2015, and 2018 appraisals this timber’s value has also increased per acre every time. However, the property’s appraisal has not. In fact, it declined by …

Read more
Geoff Gannon March 26, 2019

Ball (BLL): A Debt Laden, “Economic Value Added” Obsessed Organization with a Super Wide Moat

Write-up by Mister Compounder


The 3 most important variables to the Ball (BLL) investment thesis are:

  1. The industry structure and the symbiotic relationship with beverage companies, that naturally leads to “survival of the fattest”.
  2. The EVA approach that links interesting site economics to the creation of shareholder value.
  3. Credit risk (having the right level of debt).


Ball is one of the world’s leading suppliers of metal packaging to the beverage and food industry. The company has a long history and was founded in 1880. Through its entire history, Ball has been involved in close to fifty different segments. Today, the business is mainly based on delivering aluminum beverage containers to the beverage industry. The company’s business is about delivering aluminum cans to large consumer staple companies like: Coca Cola, Unilever and AB InBev.

This sounds like a really dull, capital intensive and boring business. So, why should it interest you?


Interesting Site Economics

The source of Ball´s competitive advantage is dependent on local scale and switching costs, resting on a highly consolidated industry among both producers and customers. The plants making the beverage container cans are huge. This is best illustrated by the size range of the production plants from about 100,000 square feet to around 700,000 square feet. The company’s largest site is the Findlay, Ohio plant (733,000 square feet) that produces both beverage cans containers and food containers.


To get an understanding of the underlying unit economics driving both revenue and profitability at Ball, it might be interesting to do some guesstimates on the profitability of the site locations.


In the North American segment, the beverage container industry represents about 110 billion units, where five companies dominate the market in the U.S, Canada and Mexico. For fiscal year of 2017, Ball produced 46 billion units, hitting a market share of 42%. This volume is served by 19 plants in the US, 1 in Canada and 2 in Mexico. They have also one joint venture production facility, but I have not included that one in this calculation. In total 22 plants, which means an average of 2.1 billion units per plant per year.


This means that – each year – the typical Ball plant should make:

  • 1 billion units
  • $190 million in revenues
  • $37 million in gross profit at a 19.5% gross profit margin
  • $25 million in operating profit at a 13% operating margin
  • Which is: $624 of revenue per square foot in and $81 in profit per square foot


Ball typically generates 9 cents in revenues per beverage can and 1.2 cents in operating profit per can. This is what generates sales and earnings at Ball. In other words, these are huge operations. Just like with distributors, it will be difficult to compete with a fully functioning and operative production plant. Given this, it is highly unlikely that a competitor would add excess capacity near an existing plant. It leads naturally to local markets as it does not make sense to transport the products …

Read more